Key Points
In a mouse model for GATA2 deficiency, leukemia emerges from BMF.
Maladaptation to proliferative signals, aging, and chromosomal segregation defects contribute to hematologic phenotypes in GATA2 deficiency.
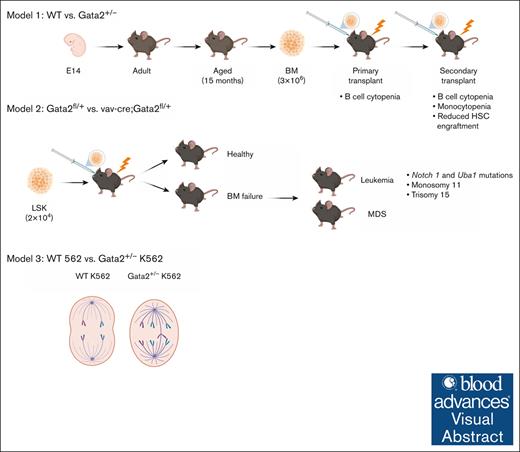
Visual Abstract
The GATA2 transcription factor is a pivotal regulator of hematopoiesis. Disruptions in the GATA2 gene drive severe hematologic abnormalities and are associated with an increased risk of myelodysplastic syndromes and acute myeloid leukemia; however, the mechanisms underlying the pathophysiology of GATA2 deficiency still remain unclear. We developed 2 different mouse models that are based on serial and limiting donor-cell transplantation of (14-15 months) GATA2 haploinsufficient cells and mirror the symptoms of GATA2 deficiency. Similar to what has been observed in patients, our models showed that GATA2 haploinsufficiency leads to B lymphopenia, monocytopenia, lethal bone marrow failure (BMF), myelodysplasia, and lymphoblastic leukemia. Leukemia arises exclusively because of BMF, driven by somatic aberrations and accompanied by increased Myc target expression and genomic instability. These findings were confirmed in human GATA2+/− K562 cell lines showing defects in cytokinesis and are in line with the fact that monosomy 7 and trisomy 8 are frequent events in patients with myelodysplastic syndrome.
Introduction
GATA2 plays an essential role in hematopoietic stem and progenitor cell (HSPC) development and differentiation.1 Patients with GATA2 germ line mutations suffer from monocytopenia, B-cell and natural killer-cell lymphopenia, neutropenia, and an inversion of the CD4/CD8 T-cell ratio, but most notably, bone marrow failure (BMF)2,3 and are predisposed to myelodysplastic syndrome (MDS) and acute myeloid leukemia (AML).4 Although several genetic alterations are known to cause BMF and predispose to myeloid neoplasia,5,6 GATA2 deficiency syndrome stands out because of its high risk of malignant transformation, with 80% of patients aged 40 having developed MDS/AML.7 So far, >400 GATA2 germ line mutations have been identified,1,8-10 but a clear genotype-phenotype correlation could not be established due to high patient variability.7,11-13
GATA2 is expressed in immature stem and progenitor cells, as well as in mature hematopoietic cell types such as megakaryocytes, mast cells, and monocytes,14-17 and is essential for the generation and maintenance of hematopoietic stem cells (HSCs) in the aorto-gonad-mesonephros region in the murine embryo.18-22
In heterozygous mouse embryos and adults, HSPCs defined as lineage-marker–negative, Sca+Kit+ (LSK) cells are significantly reduced23 in number and functionality.24,25 Interestingly, several phenotypes found in GATA2 deficiency can be recapitulated in zebrafish, where the GATA2 gene is duplicated into Gata2a and Gata2b. Although Gata2a is mostly expressed in endothelia and is required for generation of the first HSPCs through endothelial-to-hematopoietic transition, Gata2b is expressed mostly in HSPCs after endothelial-to-hematopoietic transition. Complete loss of Gata2b is nonlethal in zebrafish and results in neutropenia.26,27 Heterozygous mutations in Gata2b result in dysplasia in adult zebrafish.28,29 Interestingly, the conserved +9.5 enhancer of GATA2, which is also mutated in some patients and required for embryonic and adult hematopoiesis,30 drives Gata2a messenger RNA expression. A complete deletion of this enhancer results in monocytopenia, and occasionally, acute leukemia.31
Here, we characterized 2 distinct mouse models and a human cell model to investigate GATA2 haploinsufficiency. Our models recapitulate GATA2-deficiency–associated hematological phenotypes such as B lymphopenia and monocytopenia and provide a unique opportunity to study leukemogenesis in this disease setting. In our model, leukemia emerges exclusively as a result of severe BMF, accompanied by increased Myc target expression and genomic instability.
Methods
Mouse maintenance
Gata2+/− mice19 were maintained on a C57BL/6 background and genotyped as previously described.24Vav-cre;Gata2fl/+ mice32 were kindly provided by Elaine Dzierzak (Edinburgh, Scotland) and genotyped as described. B6.SJL-Ptprca Pepcb/BoyJ mice served as recipients. Animals were housed under specific pathogen-free conditions. All experiments were performed in accordance with animal welfare regulations (detailed information on primers is provided in the supplemental Table 1).
BM sampling
Mouse bone marrow (BM) was obtained by flushing femurs, tibias, and pelvis using a 27G (BD) needle with phosphate-buffered saline supplemented with 5 IU/mL penicillin (P), 5 μg/mL streptomycin (S), and 10% fetal calf serum (FCS) and stored on ice until use.
LSK cells isolation for transplantation or in vitro experiments
Filtered BM-cell suspension was depleted of lineage-marker positive cells (catalog no. 130-090-858; Miltenyi Biotec) according to manufacturer’s instructions. Lineage negative cells were stained with Sca1+cKit+ antibodies plus a viability dye to exclude dead cells (eFluor 506), and sorted accordingly (FACSAria Fusion, FACSAria III, and MoFlo Astros EQ; BD Biosciences). For in vitro experiments, LSK cells were cultured in 96-well U-bottom plates (25 000 cells per well in 200 μL Iscove modified Dulbecco medium; Sigma Aldrich) in PS-FCS and recombinant murine cytokines stem cell factor, thrombopoietin, and FLT3L (100 ng/mL each; ImmunoTools, Friesoythe, Germany) at 5% CO2 and 37°C.
Transplantation experiments
About 3 × 10⁶ freshly-isolated nucleated BM CD45.2+ cells from 65-week-old Gata2+/− mice were transplanted via tail vein injection into lethally-irradiated (10.5Gy) CD45.1+ recipient mice (Figure 2). Donor-cell chimerism was determined in peripheral blood (PB). Four months after transplantation, cells were retransplanted into new lethally-irradiated recipients.
Similarly, 25 000 LSK cells isolated from adult (8-12 weeks old) Gata2fl/+ or vav-cre;Gata2fl/+ mice were transplanted into CD45.1+ recipients. Six weeks after the first transplantation, 25 000 CD45.2+ LSK cells were retransplanted into secondary recipients.
CD45.1+ mice recipients were lethally irradiated (9.5 Gy) and reconstituted by retro-orbital injection of 20 000 LSK cells isolated from 8 to 12 weeks Gata2fl/+ or vav-cre;Gata2fl/+ mice (Figure 3).
Cell staining
All hematopoietic organs were incubated for 15 minutes in red blood cell lysis buffer (150 mM NH4Cl, 10 mM NaHCO3, and 1 mM EDTA) and stained with antibodies described in supplemental Table 2. For intracellular antigens, cells were fixed and permeabilized with Cytofix/Cytoperm Kit (BD Biosciences).
Cell proliferation was determined using CellTrace carboxyfluorescein diacetate succinimidyl ester Cell Proliferation Kit (Thermo Fisher Scientific) and analyzed via flow cytometry after 72 or 96 hours of culture at 37°C with 5% CO2 in Iscove modified Dulbecco medium, PS-FCS (together with Flt3L, thrombopoietin, and stem cell factor) or without cytokines. Apoptosis was determined either by using fluorescein isothiocyanate annexin-V Apoptosis Detection Kit I (BD Biosciences) according to manufacturer instructions or by combining annexin-V with DAPI (4,6-diamidino-2-phenylindole) (Molecular Probes). Cell cycle analysis was performed on fixed cells stained with DAPI and ki67 fluorescein isothiocyanate (Thermo Fisher Scientific) 1:25. Senescence was measured using the CellEvent Senescence Green Detection Kit (Thermo Fisher Scientific). Cells were acquired via flow cytometry (LSR Fortessa, FACS Aria 3, LSR 2; BD Bioscience) and analyzed with FlowJo (FlowJo LLC, Becton Dickinson). The gating strategy is shown in supplemental Figure 1.
Colony-forming unit assay
About 500 freshly-sorted cells were seeded in MethoCult GF M3434 (Stem Cell Technologies) and colonies were scored after 10 days. Afterwards, MethoCult was dissolved using phosphate-buffered saline and up to 10 000 cells were re-plated.
Histopathology
Murine sterna were fixed in 4% formalin, decalcified in EDTA, and paraffin embedded. Sections (3-5 μm) were stained with hematoxylin and eosin. Immunohistochemistry was performed on an automated immunostainer (Ventana Medical Systems) according to the company’s protocols. Antibodies are listed in supplemental Table 2. Pictures were taken on an Axioskop 2 plus Zeiss microscope equipped with a Jenoptik and ProgRes C10.
RNA-sequencing (RNA-seq) and gene set enrichment analysis (GSEA)
RNA was extracted with TRIzol from BM-derived, lineage-marker–negative cells with the RNeasy Micro kit (Qiagen). Sequencing libraries were prepared using the TruSeq stranded messenger RNA Library Prep Kit (Illumina) or SMARTer Ultra Low RNA kit (Clontech Technologies Inc) and sequenced on both the HiSeq and NovaSeq 6000 instruments (Illumina) and analyzed as described previously.31-36
Statistics
Data are presented as mean ± standard error of the mean. All statistical analysis was carried out in GraphPad Prism 8.0.1 (GraphPad Software Inc.). Normally distributed data were analyzed using the nonparametric Mann-Whitney test. A P value <.05 was considered significant.
Results
Aging in Gata2 heterozygous mice is associated with loss and functional defects of HSCs
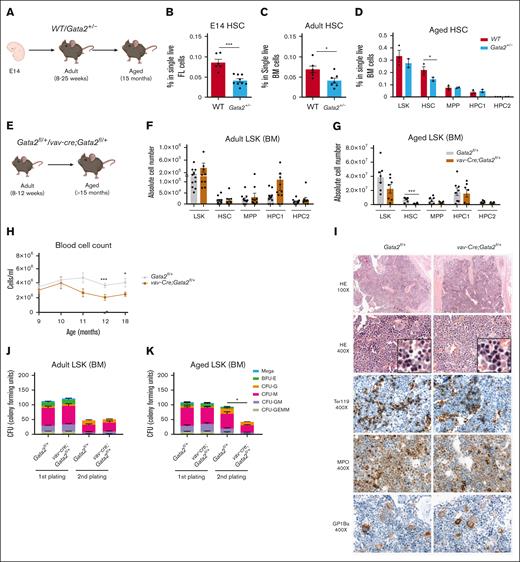
In individuals with monoallelic germ line GATA2 mutations, the risk of hematological complications rises with age.7 Therefore, we studied the hematopoietic system of Gata2+/− mice from embryonic stages to 15 months of age. The Gata2+/− HSPC compartment (Figure 1A) had fewer phenotypic HSCs in the embryonic fetal liver and BM of adult (8-25 weeks) and aged mice (15 months) compared to wildtype (WT) mice (Figure 1B-D). No other hematological phenotypes such as cytopenias were detected in either adult or aged Gata2+/− mice (not shown).
Aged Gata2+/− and vav-cre;Gata2fl/+ mice exhibit diminished HSC functionality together with significant defects when subjected to proliferative stress. (A) Representative example of the developmental stage and genotype of the mice used in the study. % of HSCs in both WT (red) and Gata2+/− (blue) from embryo (E14) (B), adult (8-25 weeks) (C), and aged (15 months) (D) mice. Representative example of the developmental stage and genotype of the mice used in the study (E). Number of stem and progenitor cells in adult (F) Gata2fl/+ (gray) and vav-Cre;Gata2fl/+ (brown) and aged mice (G). Blood cell count of Gata2fl/+ and vav-Cre;Gata2fl/+ over the time (H). Histopathology performed on sternum from aged Gata2fl/+ and vav-Cre;Gata2fl/+ mice (I). Adult HSC cells from both Gata2fl/+ and vav-Cre;Gata2fl/+ adult mice were serially cultured in CFU (J, first plate; K, re-plating). ∗P < .05; ∗∗∗P < .001. BFU-E, burst-forming unit erythroid; CFU, colony-forming unit assays; G, granulocyte precursor cell; GMEM, granulocyte, monocyte, erythrocyte, and megakaryocyte; GM, granulocyte-macrophage progenitor; H&E, hematoxylin and eosin; HPC, hematopoietic progenitor cell; M, monocytic precursor cells; MPO, myeloperoxidase staining; MPP, multi-potent progenitor.
Aged Gata2+/− and vav-cre;Gata2fl/+ mice exhibit diminished HSC functionality together with significant defects when subjected to proliferative stress. (A) Representative example of the developmental stage and genotype of the mice used in the study. % of HSCs in both WT (red) and Gata2+/− (blue) from embryo (E14) (B), adult (8-25 weeks) (C), and aged (15 months) (D) mice. Representative example of the developmental stage and genotype of the mice used in the study (E). Number of stem and progenitor cells in adult (F) Gata2fl/+ (gray) and vav-Cre;Gata2fl/+ (brown) and aged mice (G). Blood cell count of Gata2fl/+ and vav-Cre;Gata2fl/+ over the time (H). Histopathology performed on sternum from aged Gata2fl/+ and vav-Cre;Gata2fl/+ mice (I). Adult HSC cells from both Gata2fl/+ and vav-Cre;Gata2fl/+ adult mice were serially cultured in CFU (J, first plate; K, re-plating). ∗P < .05; ∗∗∗P < .001. BFU-E, burst-forming unit erythroid; CFU, colony-forming unit assays; G, granulocyte precursor cell; GMEM, granulocyte, monocyte, erythrocyte, and megakaryocyte; GM, granulocyte-macrophage progenitor; H&E, hematoxylin and eosin; HPC, hematopoietic progenitor cell; M, monocytic precursor cells; MPO, myeloperoxidase staining; MPP, multi-potent progenitor.
To investigate whether the BM HSC reduction was caused by hematopoietic-specific functions of Gata2, we deleted 1 Gata2 allele selectively in the hematopoietic compartment (vav-cre;Gata2fl/+), leading to GATA2 haploinsufficiency after HSC generation37 (Figure 1E). At the age of 8 to 12 weeks, adult vav-cre;Gata2fl/+ mice exhibited neither a decrease in BM HSC numbers (Figure 1F), nor any other discernible hematological phenotype compared to control Gata2fl/+ mice (supplemental Figure 2A). However, aged vav-cre;Gata2fl/+ mice (>15 months) showed a significant loss of HSCs (Figure 1G), accompanied by mild cytopenia, which was initially observed at 11 to 12 months of age (Figure 1H). No other alteration of the BM compartment of 60-weeks old vav-cre;Gata2fl/+ mice was observed compared to Gata2fl/+ mice (supplemental Figure 2B). Histology of the sternum showed mild dysplasia of the erythroid lineage (Figure 1I). This suggests that the decrease in HSCs observed in embryonic and adult Gata2+/− mice harboring a germ line mutation is primarily caused by defects during embryonic HSC development and/or microenvironmental influences. In contrast, HSC loss during aging is an intrinsic cellular effect of GATA2 haploinsufficiency.
To functionally characterize GATA2 haploinsufficient HSPCs, we performed colony-forming assays with serial re-plating. Adult Gata2+/− HSCs, defined as CD48–CD150+ LSK cells, did not show any differentiation defect (supplemental Figure 2C-D). Similarly, re-plating of adult vav-cre;Gata2fl/+ LSK cells did not reveal any differentiation defect (Figure 1J). In contrast, significantly fewer vav-cre;Gata2fl/+ than Gata2fl/+ colonies were formed after re-plating of aged LSK cells (Figure 1K). The lack of erythroid, monocytic, and granulocytic cells vav-cre;Gata2fl/+ colonies in secondary plates indicated a compromised self-renewal ability of aged vav-cre;Gata2fl/+ stem cells.
B lymphopenia and monocytopenia after transplantation of aged Gata2+/− BM
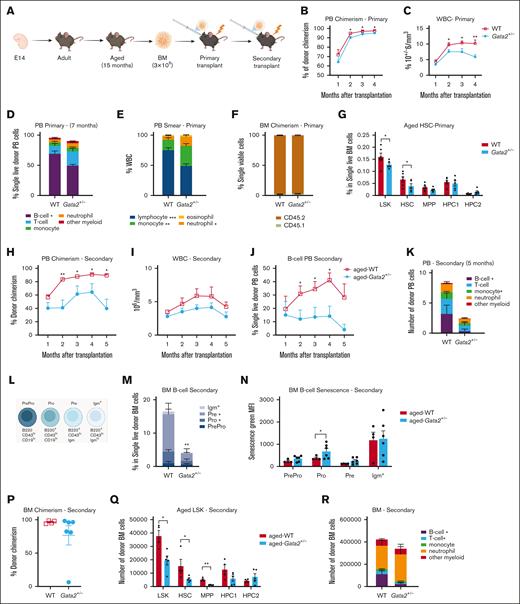
Despite the functional defects of aged HSCs, no pathologies such as BMF or leukemia were seen in aged Gata2+/− or vav-cre;Gata2fl/+ mice. This might be explained by the lack of proliferative stress, caused by environmental stimuli. Therefore, we challenged the aged hematopoietic system by serial transplantations of 3 × 10⁶ BM cells isolated from 15 months Gata2+/− and WT donor mice (Figure 2A). Primary BM transplantation of aged-Gata2+/− cells resulted in a mild but significant reduction of donor chimerism in PB (Figure 2B). Total white blood cell count was significantly decreased (Figure 2C), mostly due to a decrease in the B-cell compartment compared to WT transplanted mice (Figure 2D-E), recapitulating the most reproducible phenotype in patients with GATA2 deficiency.38 Total BM chimerism was not altered, indicating a selective differentiation defect of the B-cell lineage (Figure 2F). Notably, the HSC compartment was significantly reduced in mice transplanted with aged Gata2+/− BM compared to aged WT-transplanted mice (Figure 2G). After secondary transplantation (Figure 2A), donor chimerism in PB was consistently reduced (Figure 2H), although recipient cells now compensated white blood cell numbers (Figure 2I). Donor-derived B lymphopenia persisted in secondary recipients transplanted with aged-Gata2+/− BM (Figure 2J). In addition, monocytopenia was now observed in aged Gata2+/− transplanted mice when assessing donor-derived cells (Figure 2K).
Characterization of aged Gata2+/− transplanted mice. (A) Representative example of the transplantation assay performed with aged WT and Gata2+/− mice. (B) PB chimerism analysis performed over the months in WT and Gata2+/− mice. (C) Total WBC count analyzed over the time in WT and Gata2+/− mice. (D) Analysis of the different donor blood cell subsets performed in PB 7 months after primary transplantation in WT and Gata2+/− mice. (E) Analysis of the different blood cells subsets from PB smears 7 months after primary transplantation in WT and Gata2+/− mice. (F) BM chimerism analyzed 7 months after transplantation. (G) Analysis of the donor aged HSC BM compartment 7 months after primary transplantation in WT and Gata2+/− mice. (H) Representative example of the secondary transplantation assay performed with aged WT and Gata2+/− mice. (I) PB chimerism analysis performed in WT and Gata2+/− mice. (J) Total WBC count analyzed over the time in WT and Gata2+/− mice. (K) Donor B-cell analysis from PB 4 months after secondary transplantation in WT and Gata2+/− mice. (L) Analysis of the different donor blood cell subsets performed in PB 4 months after secondary transplantation in WT and Gata2+/− mice. (M) Schematic representation of B-cell differentiation in WT and Gata2+/− mice. (N) Donor B-cell differentiation in BM after secondary transplantation in WT and Gata2+/− mice. (O) Donor B-cell senescence analyzed 4 months after secondary transplantation in WT and Gata2+/− mice. (P) BM chimerism analyzed after secondary transplantation in WT and Gata2+/− mice. (Q) Analysis of aged donor HSC BM compartment 4 months after secondary transplantation. (R) Analysis of the different donor blood cell subsets performed in PB 4 months after secondary transplantation in WT and Gata2+/− mice. IgM, immunoglobulin M; WBC, white blood cell.
Characterization of aged Gata2+/− transplanted mice. (A) Representative example of the transplantation assay performed with aged WT and Gata2+/− mice. (B) PB chimerism analysis performed over the months in WT and Gata2+/− mice. (C) Total WBC count analyzed over the time in WT and Gata2+/− mice. (D) Analysis of the different donor blood cell subsets performed in PB 7 months after primary transplantation in WT and Gata2+/− mice. (E) Analysis of the different blood cells subsets from PB smears 7 months after primary transplantation in WT and Gata2+/− mice. (F) BM chimerism analyzed 7 months after transplantation. (G) Analysis of the donor aged HSC BM compartment 7 months after primary transplantation in WT and Gata2+/− mice. (H) Representative example of the secondary transplantation assay performed with aged WT and Gata2+/− mice. (I) PB chimerism analysis performed in WT and Gata2+/− mice. (J) Total WBC count analyzed over the time in WT and Gata2+/− mice. (K) Donor B-cell analysis from PB 4 months after secondary transplantation in WT and Gata2+/− mice. (L) Analysis of the different donor blood cell subsets performed in PB 4 months after secondary transplantation in WT and Gata2+/− mice. (M) Schematic representation of B-cell differentiation in WT and Gata2+/− mice. (N) Donor B-cell differentiation in BM after secondary transplantation in WT and Gata2+/− mice. (O) Donor B-cell senescence analyzed 4 months after secondary transplantation in WT and Gata2+/− mice. (P) BM chimerism analyzed after secondary transplantation in WT and Gata2+/− mice. (Q) Analysis of aged donor HSC BM compartment 4 months after secondary transplantation. (R) Analysis of the different donor blood cell subsets performed in PB 4 months after secondary transplantation in WT and Gata2+/− mice. IgM, immunoglobulin M; WBC, white blood cell.
B-cell differentiation was blocked due to increased senescence in pro-B cells in aged Gata2+/− BM-transplanted mice compared to WT (Figure 2L-N). This block was only partial and, even though immunoglobulin M+ class switched B cells were reduced, they remained detectable, as previously seen in patients.39 BM cellularity was comparable in both groups 5 months after secondary transplantation (supplemental Figure 3B), but BM chimerism was reduced in 3 out of 6 mice transplanted with aged Gata2+/− BM, indicating HSC exhaustion (Figure 2P). Supporting this finding, a significant reduction in the absolute numbers of multipotent progenitors (MPPs) and HSCs in BM of mice after secondary transplantation with aged-Gata2+/− BM was found (Figure 2Q). T-cell differentiation was significantly reduced in BM of mice transplanted with aged-Gata2+/− BM compared to WT (Figure 2R). The number and differentiation of myeloid and erythroid cells in the BM of aged Gata2+/− BM secondary transplanted mice were not altered despite the monocytopenia found in PB (Figure 2R; supplemental Figure 3A).
To show that the phenotypic changes are a result of the aged Gata2+/− hematopoietic system, similar experiments were performed using LSK cells isolated from 8- to 16-week old vav-cre; Gata2fl/+ mice (supplemental Figure 3C). Marginal differences in organ cell counts of spleen and lymph node (LN) were observed in primary and secondary recipients of vav-cre;Gata2fl/+ LSK cells (supplemental Figure 3D-E), whereas no other phenotypes were identified (supplemental Figure 3F and not shown), confirming that the aging of Gata2+/− HSPCs is important for the functional defects, recapitulating cytopenias frequently observed in patients.
Gata2 haploinsufficiency predisposes to lethal BMF and leukemia
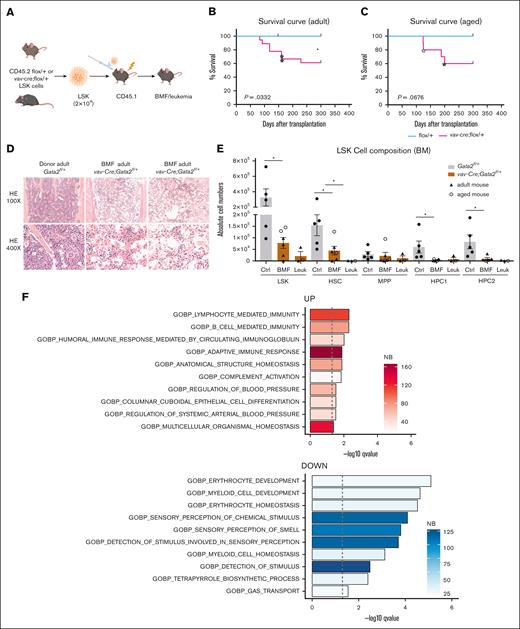
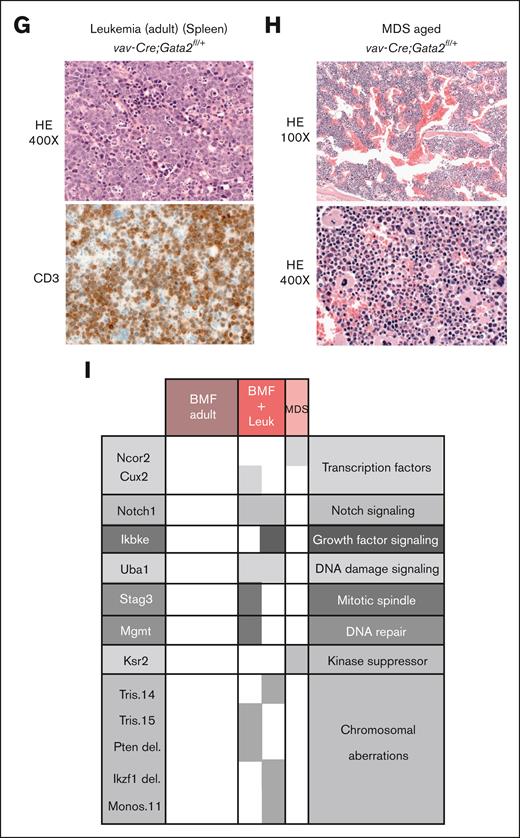
In a second approach, we challenged the haploinsufficient GATA2 hematopoietic system by transplanting low numbers (ie, 2 × 10⁴) of sorted LSK cells into lethally-irradiated WT recipients. Donor LSK cells were derived from both adult (8-12 weeks) and aged (54 weeks) Gata2fl/+ and vav-cre;Gata2fl/+ mice (Figure 3A). Recipient mice were monitored closely for up to 1 year. In both groups, adult and aged Gata2fl/+ and vav-cre;Gata2fl/+ donor cells engrafted successfully (adult: Gata2fl/+ n = 10; vav-cre;Gata2fl/+, n = 18; aged: Gata2fl/+ n = 7; vav-cre;Gata2fl/+ n = 10). However, 10 recipients transplanted with vav-Cre;Gata2fl/+ LSK cells had to be sacrificed between 100 and 200 days after transplantation because of a severe deterioration of their condition (adult: n = 6/18, aged: n = 4 of 10). Median time from transplantation to death was 118 days (range, 83-160 days) in adult and 160 days (range, 125-200) in aged mice. In contrast, all mice from both ages transplanted with Gata2fl/+ LSK cells remained healthy (Figure 3B-C). Analysis of succumbed vav-Cre;Gata2fl/+ recipients revealed BMF in 6 animals (adult: n = 4, aged: n = 2). Histopathological and flow cytometric analysis of their sternum showed aplastic BM (Figure 3D) and significant alterations in the HSPC compartment (Figure 3E) respectively, together with a reduction in almost all hematopoietic lineages (supplemental Figure 4A). RNA-seq of Ly5.2+ BM cells isolated 14 days after transplantation revealed a significantly reduced differentiation signature of both erythroid and myeloid lineages in vav-Cre;Gata2fl/+ cells compared to WT (Figure 3F). This suggests that the lineage differentiation defects are cell intrinsic and are driven by defects occurring quickly after transplantation.
Transplantation of vav-cre;Gata2fl/+ LSK into lethally-irradiated mice leads to BMF and leukemia. (A) Representative example of the transplantation assay performed with Gata2fl/+ and vav-Cre;Gata2fl/+ mice. Survival curves obtained after subjecting adult (B) and aged (C) Gata2fl/+ and vav-Cre;Gata2fl/+ mice to transplantation and followed over the time. Blue stars show the mice that succumbed due to leukemia. (D) Hematoxylin and eosin (H&E) staining performed on sternum obtained from donor and succumbed mice due to BMF leukemic and myelodysplasic mice at original magnification ×100 and original magnification ×400. (E) Analysis of the different BM-cell subsets from animals that succumbed due to BMF and leukemia compared to Gata2fl/+ mice. (F) GSEA of RNA-seq analysis of CD45.2+ BM cells from Gata2fl/+ and vav-Cre;Gata2fl/+ mice. X-axis indicates significance value. (G) H&E and CD3 IHC performed on spleen obtained from an adult succumbed mouse due to leukemia. (H) H&E staining performed on BM obtained from an aged succumbed mouse due to MDS. (I) WES and array-CGH analysis performed on BM samples obtained from succumbed animals due to BMF, leukemia, and MDS. ∗P < .05. CGH, comparative genomic hybridisation; Ctrl, control; IHC, immunohistochemistry; Leuk, leukemia; NB, number of genes in the leading edge of GSEA; WES, whole exome sequencing.
Transplantation of vav-cre;Gata2fl/+ LSK into lethally-irradiated mice leads to BMF and leukemia. (A) Representative example of the transplantation assay performed with Gata2fl/+ and vav-Cre;Gata2fl/+ mice. Survival curves obtained after subjecting adult (B) and aged (C) Gata2fl/+ and vav-Cre;Gata2fl/+ mice to transplantation and followed over the time. Blue stars show the mice that succumbed due to leukemia. (D) Hematoxylin and eosin (H&E) staining performed on sternum obtained from donor and succumbed mice due to BMF leukemic and myelodysplasic mice at original magnification ×100 and original magnification ×400. (E) Analysis of the different BM-cell subsets from animals that succumbed due to BMF and leukemia compared to Gata2fl/+ mice. (F) GSEA of RNA-seq analysis of CD45.2+ BM cells from Gata2fl/+ and vav-Cre;Gata2fl/+ mice. X-axis indicates significance value. (G) H&E and CD3 IHC performed on spleen obtained from an adult succumbed mouse due to leukemia. (H) H&E staining performed on BM obtained from an aged succumbed mouse due to MDS. (I) WES and array-CGH analysis performed on BM samples obtained from succumbed animals due to BMF, leukemia, and MDS. ∗P < .05. CGH, comparative genomic hybridisation; Ctrl, control; IHC, immunohistochemistry; Leuk, leukemia; NB, number of genes in the leading edge of GSEA; WES, whole exome sequencing.
Three BMF mice (adult: n = 2, aged: n = 1) presented with donor-derived T-cell leukemia (red stars in Figure 3B-C) with thymic and splenic involvement (spleen, Figure 3G). All 3 had few leukemic cells in the otherwise empty BM (supplemental Figure 4A). One of the succumbed mice transplanted with aged vav-Cre;Gata2fl/+ cells showed a normocellular dysplastic megakaryo- and erythropoiesis, left shifted myelopoiesis and increased presence of B and T cells (Figure 3H). All remaining recipients were sacrificed 1 year after transplantation. Similar to the characteristics observed in nontransplanted aged donors, there was a discernible loss of HSPCs, MPPs, and HSCs (supplemental Figure 4B) without other alterations in the BM-cell composition (supplemental Figure 4C). On the other hand, mice transplanted with both adult and aged Gata2fl/+ HSPCs cells did not show any hematological pathologies. HSPCs derived from one donor were transplanted into several recipients, using multiple donors (adult: n = 5 donors, 18 recipients; aged: n = 5 donors, 10 recipients). Importantly, HSPCs from the same donor resulted in diverse pathologies in recipient mice, irrespective of the donor's age, suggesting that leukemic events arose after transplantation rather than before (supplemental Figure 4D).
To investigate the mechanisms of leukemic transformation and MDS development, whole exome sequencing (WES) and array-comparative genomic hybridisation (CGH) were performed (adult [BMF: n = 3; BMF + leukemia: n = 1] and aged [BMF + leukemia: n = 1; MDS: n = 1)]. Although no mutations were identified in donor mice (n = 2) or animals exhibiting BMF, the somatic events were detected in mice with leukemia or MDS. In addition to mutations in oncogenes and tumor suppressors, chromosomal aberrations were detected in all analyzed mice presenting with leukemia, irrespective of whether they were transplanted with adult or aged vav-Cre;Gata2fl/+ LSK cells (Figure 3H). We identified cases with trisomy 15 (encompassing the Myc locus and corresponding to human trisomy 8) and a Pten deletion. Furthermore, both cases (2/2) with leukemia had Notch1 mutations, which are linked to T-cell acute lymphoblastic leukemia (T-ALL) leukemia in humans,40 along with Uba1 mutations also found in humans with MDS and autoinflammatory symptoms.41
Of note, clonal outgrowth of cells with genetic alterations resulting in acute T-cell leukemia occurred exclusively after BMF in our model. Whether the normocellular MDS found in 1 recipient was preceded by BMF is unclear.
Delayed hematopoietic reconstitution of Gata2+/− LSK cells precedes BMF
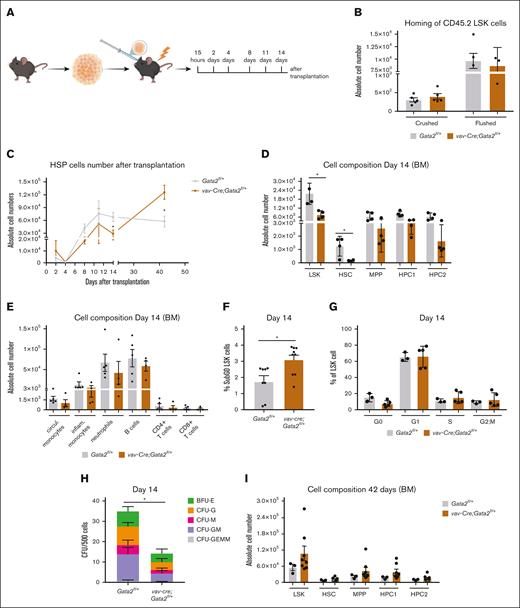
Our mouse models suggested that proliferative stress contributes to GATA2 deficient phenotypic onset. To better understand the kinetics of hematopoietic failure, we analyzed reconstitution at different time points following transplantation (Figure 4A). Homing of HSPCs to their niche, as determined 15 hours after transplantation, was not affected by GATA2 haploinsufficiency (Figure 4B). However, between day 4 and 14 after transplantation, significantly fewer vav-cre;Gata2fl/+ HSPCs were found in the recipient mice compared to Gata2fl/+ (Figure 4C), together with a significant reduction in the HSC fraction (Figure 4D) as well as a trend in the different mature cells (Figure 4E). Vav-cre;Gata2fl/+ HSPCs underwent apoptosis significantly more than Gata2fl/+ cells 14 days post transplantation shown by the increased percentage of sub-G0 apoptotic cells (Figure 4F). Although no significant differences were found in the cell cycle stages of LSK cells, few cells were found in G0 stage, indicating the high proliferative pressure on the LSK pool of Gata2fl/+ cells (Figure 4G) at this time point. The colony-forming capacity of vav-cre;Gata2fl/+ LSK cells isolated 14 days after transplantation was significantly impaired (Figure 4H). Surprisingly, 42 days after transplantation, LSK cells were found at normal or even increased numbers in all recipient mice (Figure 4I). This compensatory LSK expansion between week 2 and 6 after transplantation was corroborated by a decrease in the number of apoptotic cells (supplemental Figure 4E) without differences in the mitotic cell stages (supplemental Figure 4F). In summary, recipients of vav-Cre;Gata2fl/+ cells successfully reconstituted their hematopoietic system before developing BMF, although reconstitution was significantly delayed. It is conceivable that the initial loss of LSK cells, followed by a period of increased proliferation, resulted in clonal hematopoiesis paving the way for hematopoietic exhaustion at later time points.
vav-cre;Gata2fl/+ cells lead to a delayed hematopoietic reconstitution. (A) Representative example of the time points analyzed after transplantation with Gata2fl/+ and vav-Cre;Gata2fl/+ mice. (B) Absolute cell numbers obtained 15 hours after transplantation after crushing or flushing the bones. (C) Absolute LSK numbers analyzed over the time after transplantation. (D) Analysis of the different BM-cell subsets from Gata2fl/+ and vav-Cre;Gata2fl/+ mice 14 days after transplantation. (E) Analysis of the different blood cell subsets 14 days after transplantation in Gata2fl/+ and vav-Cre;Gata2fl/+ mice. (F) % of SubG0 LSK cells after Ki67/DAPI staining performed in Gata2fl/+ and vav-Cre;Gata2fl/+ mice. (G) % of mitotic cell stages performed in Gata2fl/+ and vav-Cre;Gata2fl/+ mice. (H) Colony-forming assays from Gata2fl/+ and vav-Cre;Gata2fl/+ LSK cells 14 days after transplantation. (I) Analysis of the HSC BM compartment from both Gata2fl/+ and vav-Cre;Gata2fl/+ mice 42 days after transplantation. ∗P < .05.
vav-cre;Gata2fl/+ cells lead to a delayed hematopoietic reconstitution. (A) Representative example of the time points analyzed after transplantation with Gata2fl/+ and vav-Cre;Gata2fl/+ mice. (B) Absolute cell numbers obtained 15 hours after transplantation after crushing or flushing the bones. (C) Absolute LSK numbers analyzed over the time after transplantation. (D) Analysis of the different BM-cell subsets from Gata2fl/+ and vav-Cre;Gata2fl/+ mice 14 days after transplantation. (E) Analysis of the different blood cell subsets 14 days after transplantation in Gata2fl/+ and vav-Cre;Gata2fl/+ mice. (F) % of SubG0 LSK cells after Ki67/DAPI staining performed in Gata2fl/+ and vav-Cre;Gata2fl/+ mice. (G) % of mitotic cell stages performed in Gata2fl/+ and vav-Cre;Gata2fl/+ mice. (H) Colony-forming assays from Gata2fl/+ and vav-Cre;Gata2fl/+ LSK cells 14 days after transplantation. (I) Analysis of the HSC BM compartment from both Gata2fl/+ and vav-Cre;Gata2fl/+ mice 42 days after transplantation. ∗P < .05.
GATA2-associated phenotypes are accompanied by increased Myc target gene expression, proliferation defects, and genomic instability
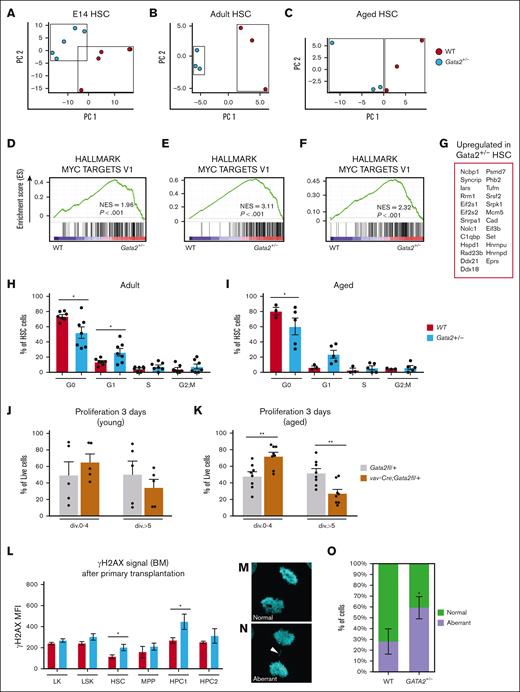
To dissect the molecular consequences of GATA2 deficiency, transcriptomes of WT and Gata2+/− HSCs at various developmental stages were investigated. The most prominent gene set that was enriched in Gata2+/− HSCs at embryonic day 14 (E14), adult, and aged HSCs was Myc Targets V1 (Figure 5A-G). GSEA analysis was visualized using Cytoscape42. This revealed that native and primary transplanted aged HSCs also upregulate gene sets related to nucleotide excision repair and DNA damage in Gata2+/− compared to WT (supplemental Figure 5A-B). Related to the immune deficiencies seen in these mice, we observed a deregulation of the B-cell regulatory pathway (supplemental Figure 5B) as well as in both myeloid and lymphoid pathways in the HSPC1 compartment (not shown).
Gata2 associated phenotypes are accompanied by proliferation defects and genomic instability. (A) PCA of E14, (B) adult, and (C) aged WT (red) and Gata2+/− (blue) HSCs. Each dot represents the transcriptome of an individual sample. (D) Hallmark GSEA of Myc targets in E14, (E) adult, and (F) aged WT and Gata2+/− HSCs. (G) Commonly upregulated genes in Myc Targets V1 GSEA upregulated in all conditions in Gata2+/− HSCs. (H) Proliferation analysis of adult (I) and aged WT and Gata2fl/+ HSCs. (J) Proliferation analysis of young and (K) aged WT and vav-Cre;Gata2fl/+ mice 3 days after carboxyfluorescein diacetate succinimidyl ester (CFSE) staining. (L) Quantification of γH2AX signals in aged-WT and aged-Gata2+/− after transplantation of LK, LSK, HSC, MPP, HPC1, and HPC2 compartments of the BM. (M-N) representative image of a WT and GATA2+/− K562 cell during anaphase of cell cycle with (M) indicating a normal proliferation event and (N) indicating an aberrant proliferation event indicated by the arrowhead and quantified in (O) N = 3 biological replicates, in total 50 anaphases scored for WT and 49 anaphases scored for GATA2+/−. ∗P < .05; ∗∗P < .01; div, cell division; MFI, mean fluorescence intensity; PC, principal component.
Gata2 associated phenotypes are accompanied by proliferation defects and genomic instability. (A) PCA of E14, (B) adult, and (C) aged WT (red) and Gata2+/− (blue) HSCs. Each dot represents the transcriptome of an individual sample. (D) Hallmark GSEA of Myc targets in E14, (E) adult, and (F) aged WT and Gata2+/− HSCs. (G) Commonly upregulated genes in Myc Targets V1 GSEA upregulated in all conditions in Gata2+/− HSCs. (H) Proliferation analysis of adult (I) and aged WT and Gata2fl/+ HSCs. (J) Proliferation analysis of young and (K) aged WT and vav-Cre;Gata2fl/+ mice 3 days after carboxyfluorescein diacetate succinimidyl ester (CFSE) staining. (L) Quantification of γH2AX signals in aged-WT and aged-Gata2+/− after transplantation of LK, LSK, HSC, MPP, HPC1, and HPC2 compartments of the BM. (M-N) representative image of a WT and GATA2+/− K562 cell during anaphase of cell cycle with (M) indicating a normal proliferation event and (N) indicating an aberrant proliferation event indicated by the arrowhead and quantified in (O) N = 3 biological replicates, in total 50 anaphases scored for WT and 49 anaphases scored for GATA2+/−. ∗P < .05; ∗∗P < .01; div, cell division; MFI, mean fluorescence intensity; PC, principal component.
Myc is a prominent oncogene43 and known to upregulate proliferation. The proliferative phenotype of Gata2+/− HSCs was validated in cell cycle analysis of adult- and aged-Gata2+/− HSC populations. Both adult and aged Gata2+/− HSCs showed a significant loss of quiescent G0 phase cells and relevant acquisition of cells in the G1 phase of cell cycle, resulting in overall loss of quiescence in the HSC compartment (Figure 5H-I).
Next, LSK cells from vav-cre;Gata2fl/+ adult and aged mice were cultured for 72 hours. Carboxyfluorescein diacetate succinimidyl ester assays revealed a delayed cell cycle progression with fewer cell divisions completed within 3 days of culture in adult mice and was more prominent in aged vav-cre;Gata2fl/+ LSK compared to control (Figure 5J-K). Given that GATA2 haploinsufficiency resulted in activation of proliferation related gene sets in all our animal models, the delayed cell cycle progression was unexpected and pointed toward a defect in cell cycle execution. Indeed, RNA-seq of LSK cells 72 hours after proliferation, followed by GSEA, revealed a tendency to a deregulation in pathways involved in DNA replication, chromatin organization, and sister chromatid segregation (supplemental Figure 6A). In addition, although freshly-isolated LSK cells showed only minor genotype–dependent differences (supplemental Figure 6B), this was increased 3 days after proliferation (false discovery rate–adjusted P value <.05: 1974 genes; supplemental Figure 6C), indicating that hematopoietic cells can compensate for GATA2 haploinsufficiency better under steady-state conditions than under proliferative stress.
On a functional level, we observed significantly increased γH2AX signal in HSCs and hematopoietic progenitor cell (HPC)1 cells of aged Gata2+/− BM after transplantation compared to WT, pointing toward the increased presence of DNA double-strand breaks (Figure 5L). Together with the chromosomal aberrations found in leukemia (Figure 3H), these data indicate the propensity for genomic instability in GATA2 haploinsufficient cells when forced to proliferate in vivo or in vitro, supporting the hypothesis that accumulated DNA damage drives leukemic progression in these animals.
To further test this, we generated GATA2+/− K562 cell lines. K562 cells are diploid for chromosome 3q, containing the GATA2 locus. Defects in cytokinesis were quantified, which is a common mechanism for karyotype changes resulting in cancer44 (Figure 5M-N). A higher percentage of GATA2+/− cells showed defects in cytokinesis compared to GATA2 WT-K562 cells (Figure 5O) indicating a direct effect of GATA2 haploinsufficiency on chromosomal segregation and a potential mechanism for leukemic transformation in GATA2 deficiency syndrome. Taken together, our findings demonstrate that Gata2-deficient mouse models need proliferative stress to develop hematological malignancies, that HSCs exhibit impaired transcriptional responses to DNA damage, and that GATA2 heterozygous deletion in cell models leads to chromosomal segregation defects during proliferation.
Discussion
Patients with GATA2 deficiency exhibit variable cytopenias and increased risk of MDS/AML.2,45-48 Despite the high prevalence of both hematological phenotypes, the connection between them remains unclear. Here, we have characterized 2 GATA2 haploinsufficient mouse models that recapitulate various patient specific aspects. Beside cytopenias, some mice presented lethal BMF with severe BM aplasia. Cytopenias arose due to forced proliferation and differentiation defects and as shown for B cells, increased senescence. Our data shows that aging and limiting dilution transplantation contributed to disease progression. Aging by itself did not result in these cytopenias; however, Gata2+/− cells were unable to handle forced proliferation effectively, a characteristic that became more evident in aged cells. In contrast to earlier mouse models,49-51 leukemias emerged in the absence of induced genetic overexpression of oncogenes and instead as a consequence of spontaneously acquired aberrations. Surprisingly, leukemia arose exclusively secondary to BMF, underscoring a causal link between these 2 hematological phenotypes.
Unlike in GATA2-deficient patients, typically developing myeloid neoplasia, the mice presented with T-cell leukemias. This difference may be attributed to the high propensity of BL/6 mice to develop immature T-cell lymphomas/leukemias.52 Nevertheless, the model allowed the investigation of different mechanisms involved in malignant transformation. HSCs underwent significant stress like aging and (limiting dilution) transplantation before leukemic transformation arose, whereas patients develop MDS spontaneously. This difference may be because mouse cells have longer telomeres than humans,53 protecting them from DNA damage, requiring a higher level of proliferative stress to become exhausted.
RNA sequencing showed robust upregulation of Myc downstream targets in Gata2 heterozygous mutant animals compared to WT. Myc is a well-known oncogene leading to increased proliferation and reducing checkpoint inhibitors, allowing defective cells in cell cycle and progression to cancer.43 Indeed, leukemic transformation and MDS were accompanied by chromosomal aberrations and somatic mutations, indicating that germ line GATA2 deficiency alone was not sufficient for transformation. Enforced Myc expression in HSCs was shown earlier to result in self-renewal of HSCs.54 It is thus conceivable that increased Myc signaling is a survival mechanism to overcome BMF leading to genomic instability. In a zebrafish model for GATA2 deficiency (gata2ai4/i4) NPM1 was identified as a possible target of GATA2 and could result in DNA damage,31 and it was shown that NPM1 binds directly to MYC, regulating hyperproliferation and malignant transformation.55,56 Furthermore, our in vitro model revealed chromosomal segregation defects and GSEA showed increased expression of genes related to DNA damage. This increases the occurrence of cytogenetic alterations and is in line with the high prevalence of monosomy 7 and trisomy 8 in human MDS with GATA2 deficiency.57
The development of both BMF and secondary leukemia is not restricted to GATA2 deficiency, but a recurrent feature of syndromes associated with DNA damage defects. A prime example is Fanconi anemia (FA), which is characterized by an impaired response to DNA damage in the FA/Breast Cancer (BRCA) pathway. In this context, HSC exhaustion and subsequent BMF, are first triggered by p53-induced apoptosis. To overcome DNA damage resulting from the accumulation of interstrand crosslinks, cells activate repair mechanisms, including increased p53 and p21 levels, thereby promoting a decline in the hematopoietic stem/progenitor pool.56 Somatic inactivation of the p53 pathway is linked to the high risk of secondary MDS (40%) and AML (15%-20%).57 Surprisingly, the risk of transformation is even higher in GATA2 deficiency compared to FA (80% by age 40).7
Although this is a sensible, likely mechanism, further research is required to understand the precise connection between MYC activity and GATA2 deficiency, and how MYC/NPM1 activity levels influence the disease phenotype, including BMF and leukemia.
One of the remaining questions is why only part of the mice succumbs after transplantation. Possibly, somatic events compensate for the germ line GATA2 defect, like epigenetic changes or increased expression from the WT allele sufficient to maintain hematopoiesis throughout life. A mechanism where the WT allele is upregulated is also seen in a zebrafish model for GATA2 deficiency (Gata2b+/−),29 although this resulted in overcompensation of the Gata2b dose along lineage differentiation, resulting in a dysplastic hematopoietic system in the zebrafish kidney marrow (BM ortholog). Allele-specific expression of GATA2 has also been reported in de novo AML with acquired GATA2 mutations. These, however, are not null alleles, and it is the mutated allele that is often expressed, suggesting a positive selection mechanism for allele-specific expression.58 It is possible that missense mutations in the ZF2 of GATA2, common in GATA2 deficiency patients, confer novel, oncogenic functions that can induce malignant transformation independently of BMF. In all genetic conditions, however, the germ line mutation alone seems not to be enough for the development of myeloid neoplasia. Understanding the nature of these somatic events, including epigenetic modifications, and differentiating between adaptive and maladaptive events will be crucial to modify the disease course and prevent MDS and leukemia.
In conclusion, this study has established that GATA2 haploinsufficiency results in increased Myc target expression, a poor proliferative stress response and reduced fitness of HSCs, resulting in cytokinesis defects and leukemic transformation.
Acknowledgments
The authors thank U. Kern for insightful discussions; N. Kaltenbach for excellent assistance; and N. Krause and her team of the Center for Experimental Models and Transgenic Services for animal care. The authors are grateful to M. Follo and her team at the Lighthouse Fluorescence Technologies Core Facility, Freiburg, for cell sorting and maintenance of flow cytometers; and Elaine Dzierzak for providing us with vav-cre;Gata2fl/+ mice.
M.E. received support from the European Research Council (“ApoptoMDS”; starting grant no. 638145; to M.E.), the German Federal Ministry of Education and Research (BMBF), Berlin (“MyPred – Network for young individuals with syndromes predisposing to myeloid malignancies”; grant no. 01GM1911A), and the EJP-RD program (RIBOEUROPE Consortium). J.F.-O is supported by the Deutsche Forschungsgemeinschaft (grant no. GZ:FE2257/1-1) and by the Hans A. Krebs Medical Scientist Program, Faculty of Medicine, Freiburg, Germany. E.d.P. is supported by KWF/Alpe d’Huzes (SK10321) and EHA junior and senior research grants. The authors acknowledge funding from the Deutsche Forschungsgemeinschaft within the Collaborative Research Center (CRC) 1160 (project ID 256073931-Z02, M.B.), CRC/TRR 167 (project ID 259373024-Z01, M.B.), CRC 1453 (project ID 431984000-S1, M.B.), CRC 1479 (project ID: 441891347- S1, M.B.), TRR 359 (project ID 491676693-Z01, M.B.), FOR 5476 UcarE (project ID 493802833-P7, M.B.). The authors also acknowledge funding from the BMBF within the Medical Informatics Funding Scheme, PM4Onco–FKZ 01ZZ2322A (M.B.) and EkoEstMed–FKZ 01ZZ2015 (G.A.).
Authorship
Contribution: J.F.-O., C.K., J.M.W., E.G., E.d.P., and M.E. designed, performed, and analyzed experiments; I.G.-M., K.J.G., and L.Q.-M. performed and analyzed the histopathology; G.A., M.t.B., R.M.-L., and M.S. analyzed whole exome sequencing (WES)/RNA-seq data; J.F.-O., C.K., J.M.W., E.G., M.t.B., B.Y., C.W., H.d.L., M.B., J.Z., R.H., K.J.G., E.B., S.P., C.M., S.B., M.W., E.d.P., and M.E. analyzed and interpreted data; C.N., M.W., and M.E. provided patient material; J.F.-O., E.d.P., C.K., and M.E. wrote the manuscript; and I.P.T. revised the manuscript.
Conflict-of-interest disclosure: The authors declare no competing financial interests.
Correspondence: Miriam Erlacher, Department of Pediatrics and Adolescent Medicine University Medical Center Ulm, Eythstr, 24 89075 Ulm, Germany; email: miriam.erlacher@uniklinik-ulm.de; and Emma de Pater, Department of Hematology, Erasmus MC Kanker Instituut Rotterdam, 3015 GD Rotterdam, The Netherlands; email: e.depater@erasmusmc.nl.
References
Author notes
J.F.-O., C.K., J.M.W., E.G., M.E., and E.d.P. contributed equally to this study.
All RNA-sequencing data will be made publicly available upon publication of this article.
The full-text version of this article contains a data supplement.

