
Skip Nav Destination
Close Modal
1-20 of 334522
Follow your search
Access your saved searches in your account
Would you like to receive an alert when new items match your search?
1
Journal Articles
Human herpesvirus 6 viremia and encephalitis in CAR T-cell recipients
Available to Purchase
Clinical Trials & Observations
Journal:
Blood
Blood (2025) 146 (25): 3124–3128.
Published: 2025
Journal Articles
CME
Clinical Trials & Observations
Journal:
Blood
Blood (2025) 146 (25): 3050–3058.
Published: 2025
Includes: Supplemental data
Journal Articles
MECOM is a master repressor of myeloid differentiation through dose control of CEBPA in acute myeloid leukemia
Available to Purchase
Brief Report
Journal:
Blood
Blood (2025) 146 (25): 3098–3105.
Published: 2025
Includes: Supplemental data
Journal Articles
LEF1 intragenic deletion induces a dominant-negative isoform and unveils a Wnt/β-catenin vulnerability in T-ALL
Available to Purchase
Clinical Trials & Observations
Journal:
Blood
Blood (2025) 146 (25): 3036–3049.
Published: 2025
Includes: Supplemental data
Journal Articles
Genomic landscape of IgM-MGUS and patients with stable or progressive asymptomatic Waldenström macroglobulinemia
Available to Purchase
Journal:
Blood
Blood (2025) 146 (25): 3086–3097.
Published: 2025
Includes: Supplemental data
Journal Articles
An immunostimulatory CELMoD combination overcomes resistance to T-cell engagers caused by a high multiple myeloma burden
Available to Purchase
Journal:
Blood
Blood (2025) 146 (25): 3072–3085.
Published: 2025
Includes: Supplemental data
Journal Articles
Chronic NK cell activation results in a dysfunctional, tissue resident–like state mediated by KLF2 deficiency
Available to Purchase
Journal:
Blood
Blood (2025) 146 (25): 3059–3071.
Published: 2025
Includes: Supplemental data
Journal Articles
Rbm38 deficiency impairs erythroid heme biosynthesis and induces porphyria via reduced ferrochelatase expression
Available to Purchase
Journal:
Blood
Blood (2025) 146 (25): 3106–3123.
Published: 2025
Includes: Supplemental data
Journal Articles
in Prognostic value of premaintenance FDG PET/CT response in patients with newly diagnosed myeloma from the CASSIOPEIA trial
> Blood
Published: 2025
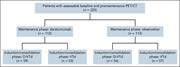
Figure 1. Consolidated Standards of Reporting Trials diagram. More about this image found in Consolidated Standards of Reporting Trials diagram.
in Prognostic value of premaintenance FDG PET/CT response in patients with newly diagnosed myeloma from the CASSIOPEIA trial
> Blood
Published: 2025
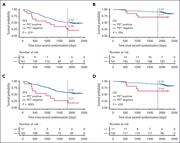
Figure 2. Survival according to PM PET. PFS (A,C) and OS (B,D) according to PM PET response in the overall population (A-B) and in daratumumab-treated patients (C-D). More about this image found in Survival according to PM PET. PFS (A,C) and OS (B,D) according to PM PET r...
in Prognostic value of premaintenance FDG PET/CT response in patients with newly diagnosed myeloma from the CASSIOPEIA trial
> Blood
Published: 2025
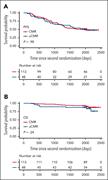
Figure 3. PFS and OS according to PM PET response. (A) PFS. (B) OS. More about this image found in PFS and OS according to PM PET response. (A) PFS. (B) OS.
in Prognostic value of premaintenance FDG PET/CT response in patients with newly diagnosed myeloma from the CASSIOPEIA trial
> Blood
Published: 2025
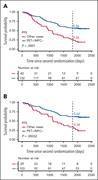
Figure 4. Survival according to PM PET and MFC. PFS according to PM PET and MFC in the overall population (A) and in daratumumab-treated patients (B): double PET- and MFC-negative patients vs other patients. More about this image found in Survival according to PM PET and MFC. PFS according to PM PET and MFC in t...
CEBPA is a target of MECOM. (A) Schematic depiction of the AID tag, follo...
Available to Purchase
in MECOM is a master repressor of myeloid differentiation through dose control of CEBPA in acute myeloid leukemia
> Blood
Published: 2025
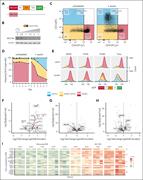
Figure 1. CEBPA is a target of MECOM. (A) Schematic depiction of the AID tag, followed by V5-T2A-eGFP introduced 3′ of MECOM in MUTZ3 cells. (B) Western blot analysis of a MUTZ3 AID-TIR1 clone for MECOM (upper) and β-actin (lower). Cells were treated with 500 μM auxin for indicated time spans.... More about this image found in CEBPA is a target of MECOM. (A) Schematic depiction of the AID tag, follo...
Untitled image
Available to Purchase
in MECOM is a master repressor of myeloid differentiation through dose control of CEBPA in acute myeloid leukemia
> Blood
Published: 2025
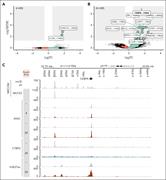
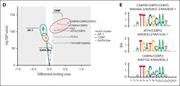
MECOM regulates CEBPA through its +42-kb enhancer. Volcano plot of differe...
Available to Purchase
in MECOM is a master repressor of myeloid differentiation through dose control of CEBPA in acute myeloid leukemia
> Blood
Published: 2025
MECOM regulates CEBPA through its +42-kb enhancer. Volcano plot of differential chromatin accessibility (ATAC-seq) of untreated (n = 3) vs treated with auxin for 4 hours (A) and 24 hours (B) (n = 2 for both; 500 μM) calculated with DiffBind. All labels containing “CEBPA” at FDR <0.05 are labeled... More about this image found in MECOM regulates CEBPA through its +42-kb enhancer. Volcano plot of differe...
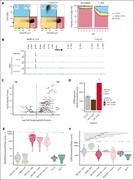
CEBPA repression by MECOM/CTBP complex is an essential event in 3q26-rearr...
Available to Purchase
in MECOM is a master repressor of myeloid differentiation through dose control of CEBPA in acute myeloid leukemia
> Blood
Published: 2025
Figure 3. CEBPA repression by MECOM/CTBP complex is an essential event in 3q26-rearranged AML. (A) Flow cytometric analysis of MUTZ3 cells transduced with a lentiviral dox-inducible CEBPA construct. Cells were treated with dox (1 μg/mL) for 7 days and stained with CD15-APC and CD34-PeCy7 (da... More about this image found in CEBPA repression by MECOM/CTBP complex is an essential event in 3q26-rearr...
Incidence of LEF1 alterations in T-ALL across the pediatric FRALLE-2000 a...
Available to Purchase
in LEF1 intragenic deletion induces a dominant-negative isoform and unveils a Wnt/β-catenin vulnerability in T-ALL
> Blood
Published: 2025
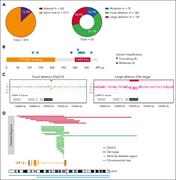
Figure 1. Incidence of LEF1 alterations in T-ALL across the pediatric FRALLE-2000 and adult GRAALL 2003-2005 trials. (A) The incidence of LEF1 gene alterations among patients with T-ALL at diagnosis across the FRALLE-2000 and GRAALL 2003-2005 studies (left). The type of genetic alterations a... More about this image found in Incidence of LEF1 alterations in T-ALL across the pediatric FRALLE-2000 a...
Clinical impact of LEF1 alterations in the pediatric FRALLE-2000 and adul...
Available to Purchase
in LEF1 intragenic deletion induces a dominant-negative isoform and unveils a Wnt/β-catenin vulnerability in T-ALL
> Blood
Published: 2025
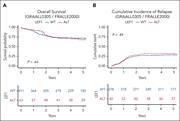
Figure 2. Clinical impact of LEF1 alterations in the pediatric FRALLE-2000 and adult GRAALL 2003-2005 trials. OS (A) and cumulative incidence of relapse (B) in the FRALLE-2000 and GRAALL 2003-2005 trials. Red curves represent the patients with LEF1 -altered T-ALL, and blue curves represent th... More about this image found in Clinical impact of LEF1 alterations in the pediatric FRALLE-2000 and adul...
The oncogenetic landscape of LEF1 -altered T-ALL. (A) Oncoplot illustrati...
Available to Purchase
in LEF1 intragenic deletion induces a dominant-negative isoform and unveils a Wnt/β-catenin vulnerability in T-ALL
> Blood
Published: 2025
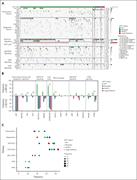
Figure 3. The oncogenetic landscape of LEF1 -altered T-ALL. (A) Oncoplot illustrating the genetic anomalies found in LEF1 -WT and LEF1 -altered T-ALL cases from the FRALLE-2000 and GRAALL 2003-2005 studies. Each column represents an individual case, annotated with defining genetic and oncogen... More about this image found in The oncogenetic landscape of LEF1 -altered T-ALL. (A) Oncoplot illustrati...
1
