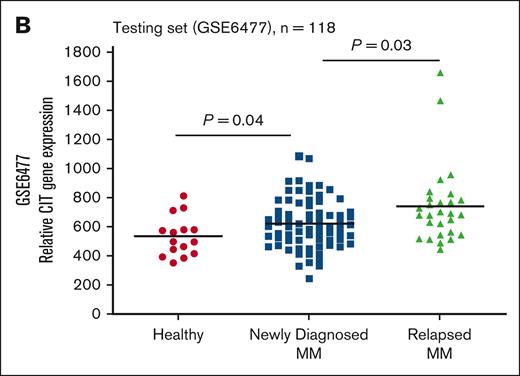
Page 997: in Figure 1B, due to an error during preparation of the figure, a point value of 1665 corresponding to “P = 0.03” is missing from the y-axis. The Figure 1B legend has also been revised to discuss the statistical method. The corrected Figure 1B is shown below:

Figure 1.
CIT is highly expressed in MM patients. (B) CIT gene expression levels in healthy control, newly diagnosed, and relapsed MM patients are shown. The P values were both calculated by using Welch’s t-test that compares groups that do not assume equal standard deviation.
These changes do not affect the scientific integrity of the figure or article.
© 2024 by The American Society of Hematology.
2024
