Key Points
The reversible fate of pirtobrutinib-tolerant persister cells in MCL is determined by the TCA cycle mode switch.
Acetyl coenzyme A is a key metabolite in regulating the stemness of pirtobrutinib-tolerant persister cells by stabilizing SNAI1.
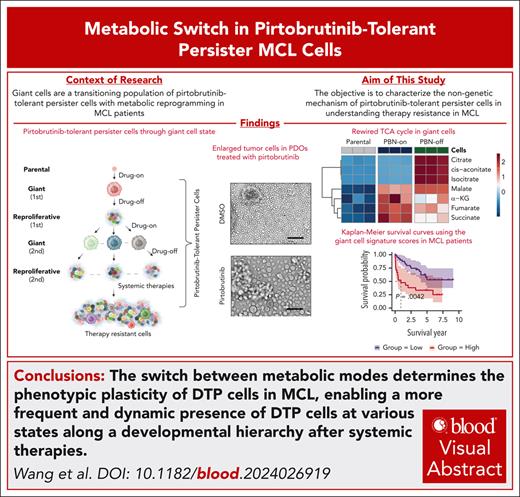
Visual Abstract
Bruton tyrosine kinase inhibitors (BTKis) and cell therapy have successfully been used to treat mantle cell lymphoma (MCL). However, therapy resistance inevitably emerges. Cancer cells can progressively develop stable resistance by traversing through a transient drug-tolerant persister (DTP) state. The mechanisms enabling DTP cells to reversibly adapt to therapies and evolve to acquire heterogeneity remain poorly understood, and characterizing DTP cells in MCL continues to pose a challenge for clinic translation. Here, using pirtobrutinib, a recently US Food and Drug Administration–approved noncovalent BTKi, we identified pirtobrutinib-tolerant persister cells exhibiting morphological variability by presenting a unique population of enlarged cells (giant cells) with reversible fate transitions. During treatment, giant cells enter a nonproliferative, dedifferentiated state, addicted to an activated cytosolic tricarboxylic acid (TCA) cycle coupled with the malate-aspartate shuttle to engage in biosynthesis. Upon drug removal, the TCA cycle shifts to oxidative catabolism, promoting giant cells to differentiate into regular-sized cells. Throughout the transition, acetyl coenzyme A modulates cell fate by fine-tuning stemness. Our biphasic model demonstrates that the metabolic switch governs the phenotypic plasticity of DTP cells in MCL, resulting in a dynamic presence of DTP cells across various developmental states in response to systemic therapies. Targeting giant cells before their differentiation offers a promising strategy to overcoming therapy resistance in MCL.
Introduction
Therapy-resistant mantle cell lymphoma (MCL) cells are known to emerge from cellular heterogeneity,1,2 with genetic mutations long recognized as key drivers of resistance.3 Quiescent cells exhibiting downregulation of committed B-cell markers have been implicated in therapy resistance,4,5 and cellular plasticity is increasingly reviewed as a mechanism that establishes resistance.6 Various models of cellular plasticity have been proposed, including those featuring drug-tolerant persister (DTP) cells characterized by phenotypic adaptability, evolvability, and stochasticity.7-11 B cells also display plasticity12; however, it remains uncertain whether DTP cells are present in patients with therapy-resistant MCL, and whether DTP cells share properties with cancer stem cells by leveraging nongenetic mechanisms.
Persistent cancer cells can survive by adapting their cellular metabolism.9,13 The noncanonical tricarboxylic acid (TCA) cycle plays a pivotal role in determining cell fate, with acetyl coenzyme A (acetyl-CoA) serving as a critical metabolite that regulates cell identity.14 Yet, how the TCA cycle switches to coordinate with other metabolic pathways to modulate cancer cell plasticity remains poorly defined.
In MCL, although potent Bruton tyrosine kinase inhibitors (BTKis) and cell therapies improved patient survival, resistance builds up progressively over the course of treatments, leaving patients with relapsed or refractory diseases.15-18 Resistance to pirtobrutinib is also emerging in patients with MCL.19,20 In this study, we demonstrate that pirtobrutinib-tolerant persister cells exhibit biphasic behavior, traversing between quiescent giant cells and proliferating progeny cells. Giant cells, identified as transformed DTP cells, survive therapies by shifting to an anabolic TCA cycle with enhanced biosynthesis. Acetyl-CoA acts as a messenger between mitochondria and the nucleus, promoting progenitor-like properties by stabilizing transcription factor snail family transcriptional repressor 1 (SNAI1). Our findings elucidate the plasticity of DTP cells in MCL, underscoring their dynamic presence in therapy-resistant patients.
Methods
Complete methods can be found in the supplemental Methods, available on the Blood website.
Patient sample collection and preparation
Patient samples were collected from patients with MCL, after the provision of informed consent and approval by the institutional review board at The University of Texas MD Anderson Cancer Center. For sequencing, fresh specimens were promptly immersed in RNAlater solution after surgical biopsy or Ficoll-Hypaque density centrifugation.
Establishment of PDOs and xenograft tumor PDXs
To generate patient-derived organoids (PDOs), samples from patients with MCL were lysed with red blood cell lysis buffer and washed twice with phosphate-buffered saline, the cell pellets were resuspended in 50% Matrigel in the culture medium containing cytokine cocktails. For patient-derived xenograft (PDX) tumor mouse generation, 5 × 10⁶ T-cell–depleted MCL cells from apheresis or PDX tumors were subcutaneously injected into NOD SCID gamma (NSG) mice (The Jackson Laboratory) housed and cared at the MD Anderson Cancer Center (MDACC) animal facility following approved protocols.
RNA sequencing (RNA-seq) and data processing
The RNA samples for bulk sequencing were prepared at our laboratory and processed using GENEWIZ. Data were analyzed by our bioinformaticians. The single-cell sequencing was performed at the Cancer Prevention & Research Institute of Texas (CPRIT) Single Cell Genomics Core Facility at MDACC; and the data were processed by our bioinformaticians.
Analysis of polar metabolites by ion chromatography–HRMS
To determine the relative abundance of polar metabolites in parental, giant, and redifferentiated cells, extracts were prepared and analyzed by ultra–high-resolution mass spectrometry (HRMS). Extracts were also prepared and analyzed by HRMS to determine the relative abundance and incorporation of glucose carbon (13C6-glucose) into glycolysis, TCA cycle, pentose phosphate pathway (PPP).
Acetyl-CoA analysis and oxygen consumption assay
To determine the intracellular relative abundance of acetyl-CoA, cell extracts were prepared and analyzed by liquid chromatography–HRMS. The oxygen consumption rate (OCR) was measured using the Seahorse XF96 analyzer (Agilent Technologies).
Cell culture
MCL cells were purchased from ATCC (American Type Culture Collection) and cultured in RPMI 1640 with 10% fetal bovine serum in 5% CO2. For 3-dimensional (3D) spheroid culture of giant cells, colonies were seeded into 12-well plates covered by medium with extensive culture. Medium was replaced every 3 days. Stabled cell lines with doxycycline induction were selected by G418 (400 μg/mL); stabled cell lines with target gene knockdown were selected by puromycin (1 μg/mL). Established cell lines were maintained by half doses of the antibiotics. Doxycycline induction (1 μg/mL) of target proteins took 48 hours. 293FT cells for lentivirus packaging was purchased from Thermo Fisher (catalog no. R70007).
Results
Enlarged tumor cells are detected in samples from patients with therapy-resistant MCL
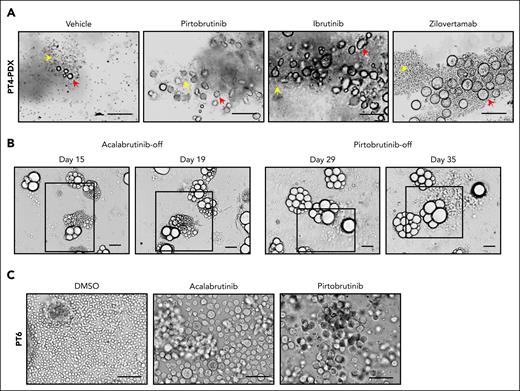
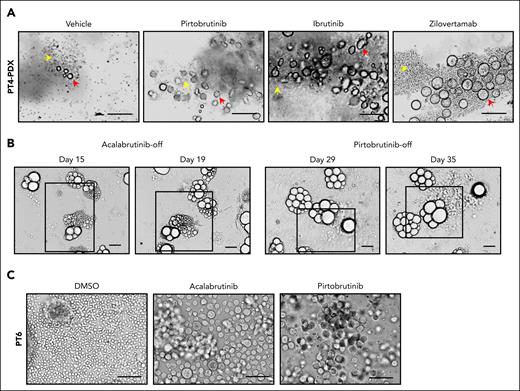
We previously reported that abnormally shaped MCL cells serve as indicators of disease aggressiveness and poor therapy response, although these correlations are poorly understood because of the sporadic and underappreciated presence of the abnormal cells.21,22 To investigate therapy resistance in patients with MCL, we generated PDX mice, using apheresis samples from 2 patients with MCL who had failed multiple therapies (patient 4 [PT4] and PT11; Table 1). As detailed in the supplemental Methods, tumor-bearing mice were treated with BTKis such as ibrutinib (IBN) and pirtobrutinib; B-cell lymphoma 2 (BCL-2) inhibitor, venetoclax (VEN); or the anti-ROR1 (receptor tyrosine kinase–like orphan receptor 1) monoclonal antibody, zilovertamab. Notably, enlarged cells were detected in these tumors (Figure 1A; supplemental Figure 1A), and were CD20+ (supplemental Figure 1B), confirming their B-cell lineage. When transferred to 3D culture without drug exposure (drug-off), these enlarged cells, pretreated with acalabrutinib or pirtobrutinib, showed reproliferation and expansion (Figure 1B). Similarly, we established PDOs from apheresis samples of 2 patients with MCL (PT3 and PT6; Table 1), in which enlarged cells emerged after BTKi treatment (Figure 1C). Ki67 level increased in the enlarged cells upon pirtoburtinib withdrawal compared with the drug-on condition (supplemental Figure 1C). Across our ex vivo cultures, the presence of enlarged cells correlated with poor therapy responses: enlarged cells were observed in all 9 samples from 8 patients with progressive disease but in only 1 of 3 patients with a complete remission (Table 1). These findings suggest that emergence of enlarged cells may confer resistance to systemic therapies and contribute tumor recurrence.
Cell morphology change renders tolerance to therapies in MCL preclinical models. (A) Enlarged tumor cells were detected in PDX samples from patient 4 (PT4) treated with BTKis (pirtobrutinib and IBN), or anti–ROR1 (receptor tyrosine kinase–like orphan receptor 1) monoclonal antibody zilovertamab. Yellow arrows, regular-sized tumor cells; red arrows, enlarged tumor cells. Scale bar, 100 μm. (B) The enlarged cells from the PDX tumor (PT4) were cultured as PDOs treated with acalabrutinib (10 μM) or pirtobrutinib (10 μM) for 2 weeks. They reproliferated as regular-sized tumor cells upon drug removal. Representative brightfield images are shown at different time points. Active proliferating/expanding cells are highlighted by squares. Scale bar, 100 μm. (C) Representative images of enlarged cells generated in the ex vivo PDO model using apheresis from PT6. The PDOs were treated with acalabrutinib and pirtobrutinib at 10 μM for over 2 weeks. Scale bar, 100 μm. DMSO, dimethyl sulfoxide.
Cell morphology change renders tolerance to therapies in MCL preclinical models. (A) Enlarged tumor cells were detected in PDX samples from patient 4 (PT4) treated with BTKis (pirtobrutinib and IBN), or anti–ROR1 (receptor tyrosine kinase–like orphan receptor 1) monoclonal antibody zilovertamab. Yellow arrows, regular-sized tumor cells; red arrows, enlarged tumor cells. Scale bar, 100 μm. (B) The enlarged cells from the PDX tumor (PT4) were cultured as PDOs treated with acalabrutinib (10 μM) or pirtobrutinib (10 μM) for 2 weeks. They reproliferated as regular-sized tumor cells upon drug removal. Representative brightfield images are shown at different time points. Active proliferating/expanding cells are highlighted by squares. Scale bar, 100 μm. (C) Representative images of enlarged cells generated in the ex vivo PDO model using apheresis from PT6. The PDOs were treated with acalabrutinib and pirtobrutinib at 10 μM for over 2 weeks. Scale bar, 100 μm. DMSO, dimethyl sulfoxide.
Pirtobrutinib-tolerant persister MCL cells escape therapy by reversible phenotypic transitions
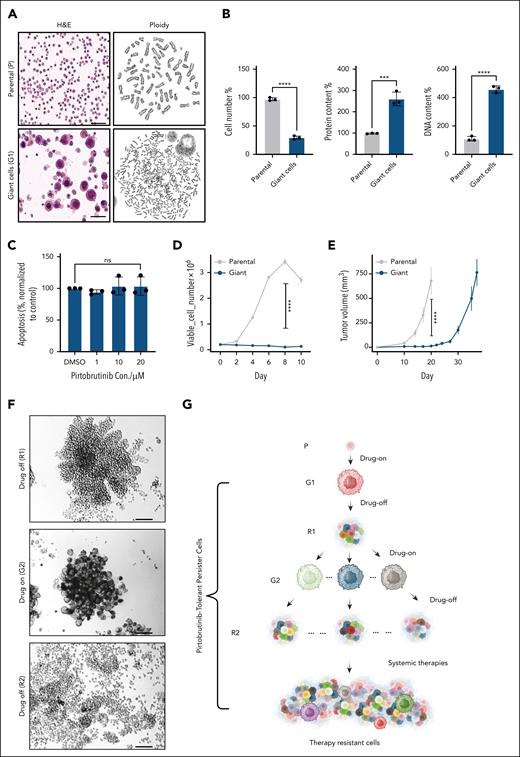
Given the heterogeneity of primary cells, we used MCL cell lines to investigate mechanisms underlying morphological changes that may confer therapy resistance. Drug-naive cells (Mino and JeKo-1) treated with a clinically relevant dose of pirtobrutinib (10 μM) underwent cell death (supplemental Figure 2A).19 In contrast, MCL cells resistant to either VEN (Mino-VEN-R) or IBN (JeKo-1-IBN-R)23,24 exhibited an increased 50% inhibitory concentration (IC50) for pirtobrutinib and significant cellular enlargement compared with drug-naive cells (Figure 2A; supplemental Figure 2B-D). Notably, the proportion of enlarged cells increased dose dependently with pirtobrutinib, plateauing at 10 μM by day 3, when most cells displayed an enlarged phenotype (supplemental Figure 2E). Enlarged cells were also seen in pirtobrutinib-treated MCL cell line MAVER-1 and diffuse large B-cell lymphoma cell line OCI-LY7 (supplemental Figure 2F). We designated these enlarged cells as “giant cells.”
Reversible cell morphology change renders tolerance to therapies in MCL cell lines. (A) Parental Mino-VEN-R cells (DMSO) and giant cells (pirtobrutinib, 10 μM; 5 days); H&E staining (left) and polyploidy analysis (right). Scale bar, 50 μm. (B) After treatment with pirtobrutinib (10 μM; 5 days), Mino-VEN-R cells developed into giant cells. Compared with proliferating parental cells, giant cells went into quiescence with increased protein and DNA quantity in each cell. (C) Apoptosis assay shows that giant cells are resistant to further treatment of pirtobrutinib. (D) Cell proliferation analysis shows halted proliferation of giant cells compared with parental cells in 2D culture. (E) Subcutaneous inoculated giant cells (105 cells) in NSG mice (n = 5) are tumorigenic with delayed progression compared with parental cells (105 cells; n = 8). (F) After pirtobrutinib removal, individual giant cells in 3D culture proliferated and regressed to original size after 11 days (R1). When they were retreated with pirtobrutinib (10 μM; >3 days), each cell developed into giant cells again (G2), and they reproliferated after pirtobrutinib removal for 19 days (R2). Scale bar, 100 μm. (G) Schematic illustration of the ontogeny of reversible pirtobrutinib-tolerant persister MCL cells. Unpaired t test. ∗∗∗P < .001; ∗∗∗∗P < .0001. Parental Mino-VEN-R (P; without pirtobrutinib) underwent morphology change to generate giant first (G1; 10 μM pirtobrutinib), reproliferated first (R1; pirtobrutinib removed), giant second (G2; 10 μM pirtobrutinib), and reproliferated second (R2; pirtobrutinib removed). DMSO, dimethyl sulfoxide; H&E, hematoxylin and eosin; ns, nonsignificant.
Reversible cell morphology change renders tolerance to therapies in MCL cell lines. (A) Parental Mino-VEN-R cells (DMSO) and giant cells (pirtobrutinib, 10 μM; 5 days); H&E staining (left) and polyploidy analysis (right). Scale bar, 50 μm. (B) After treatment with pirtobrutinib (10 μM; 5 days), Mino-VEN-R cells developed into giant cells. Compared with proliferating parental cells, giant cells went into quiescence with increased protein and DNA quantity in each cell. (C) Apoptosis assay shows that giant cells are resistant to further treatment of pirtobrutinib. (D) Cell proliferation analysis shows halted proliferation of giant cells compared with parental cells in 2D culture. (E) Subcutaneous inoculated giant cells (105 cells) in NSG mice (n = 5) are tumorigenic with delayed progression compared with parental cells (105 cells; n = 8). (F) After pirtobrutinib removal, individual giant cells in 3D culture proliferated and regressed to original size after 11 days (R1). When they were retreated with pirtobrutinib (10 μM; >3 days), each cell developed into giant cells again (G2), and they reproliferated after pirtobrutinib removal for 19 days (R2). Scale bar, 100 μm. (G) Schematic illustration of the ontogeny of reversible pirtobrutinib-tolerant persister MCL cells. Unpaired t test. ∗∗∗P < .001; ∗∗∗∗P < .0001. Parental Mino-VEN-R (P; without pirtobrutinib) underwent morphology change to generate giant first (G1; 10 μM pirtobrutinib), reproliferated first (R1; pirtobrutinib removed), giant second (G2; 10 μM pirtobrutinib), and reproliferated second (R2; pirtobrutinib removed). DMSO, dimethyl sulfoxide; H&E, hematoxylin and eosin; ns, nonsignificant.
Giant cells eventually entered a quiescent state characterized by polyploidy (Figure 2A; supplemental Video 1), which has been reported in other enlarged cancer cells as a marker of incurable malignancy.25-27 Compared with proliferating parental cells, individual giant cells exhibited increased protein and DNA content (Figure 2B). These cells resisted apoptosis upon further pirtobrutinib treatment, indicating a resistant state (Figure 2C). Giant cells did not undergo cell division or proliferation in 2D culture for 10 consecutive days, minimizing the possibility of expansion from a preexisting population of enlarged cells (Figure 2D). Transmission electron microscopy revealed an elevated number of smaller mitochondria in giant cells (supplemental Figure 2G).
Next, we investigated whether giant cells retained tumorigenic potential. Xenografted giant cells formed tumors in NSG mice, although tumor growth was delayed by ∼2 weeks compared with parental Mino-VEN-R cells (Figure 2E). To assess their reproliferation capacity, we seeded giant cells into spheroid 3D culture without pirtobrutinib, in which individual giant cells rapidly generated large colonies in 2 to 3 weeks (supplemental Figure 2H). Reintroduction of pirtobrutinib led to the reemergence of giant cells, which reproliferated upon drug withdrawal (Figure 2F; supplemental Video 2). A similar phenotype was observed with enlarged cells from PDX tumors after drug removal (supplemental Video 3). These reversible phenotypic transitions suggest the emergence of a DTP state. Upon pirtobrutinib withdrawal, giant cells resumed proliferation (R1) and remained IBN sensitive. However, the second-generation reproliferating cells (R2) developed IBN resistance (supplemental Figure 3A). We enriched this IBN-resistant population in R2 cells by treating R2 cells with 20 μM IBN for 7 days (R2-IBN-R). These cells had decreased BTK activity as shown by phosphorylation of BTK at Y223 (p-BTK-Y223), which corresponded to an impaired response to pirtobrutinib (supplemental Figure 3B). Gene set enrichment analysis (GSEA) of RNA-seq data supported these findings, showing reduced expression of genes downstream of B-cell receptor (BCR) in R2 cells. This implies the diminished reliance on BTK signaling compared with parental and R1 cells (supplemental Figure 3C). These results suggest that multiple transitions give rise to progeny cells resistant to therapies to which they were previously sensitive. Although BTK mutations have been reported to reduce p-BTK-Y223,28 whole-exome sequencing detected no BTK mutations in R2-IBN-R cells compared with R2 cells (supplemental Figure 3D).
Giant cells maintained their ability to undergo reversible morphological change in response to pirtobrutinib across at least 3 consecutive transitions. After these transitions, pirtobrutinib failed to eliminate progeny cells derived from giant cells. Instead, these progeny cells continued to expand, adapting to the intermittent treatments and ultimately developing therapy resistance. After the first generation of giant cells (G1), all subsequent cells exhibited characteristics of pirtobrutinib-tolerant persister cells, suggesting giant cells serve as a transitional state of DTP cells (Figure 2G).
Giant cells are maintained at a dedifferentiated state
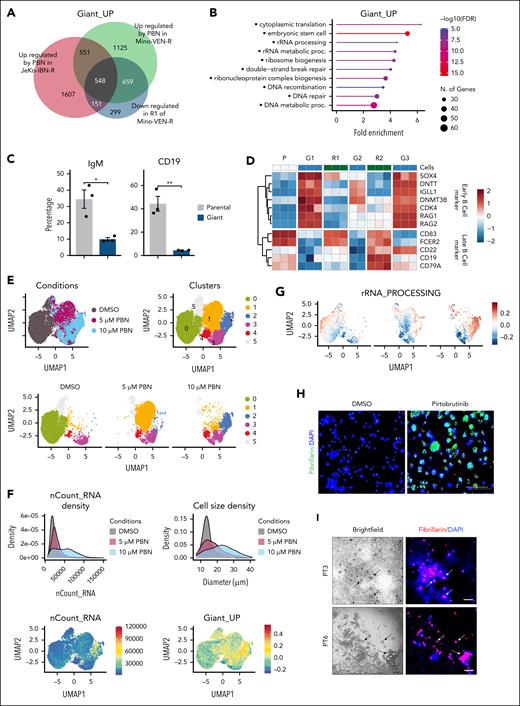
We performed bulk RNA-seq on Mino-VEN-R cells treated with increasing doses of pirtobrutinib (0, 1, 5, and 10 μM) for 5 days, as well as on reproliferating cells subject to 2 consecutive transitions with or without pirtobrutinib (10 μM). Parallel experiments were conducted on JeKo-1–IBN-R cells. Analysis of the bulk RNA-seq data revealed a giant cell–specific signature of upregulated genes (termed Giant_UP; Figure 3A). Within the Giant_UP signature, pathways related to nucleotide homeostasis and embryonic stem cell function, including ribosomal RNA (rRNA) metabolism and ribosome biogenesis, were significantly enriched (Figure 3B). Ribosome-associated genes were upregulated in giant cells and reverted to parental levels in R1 cells (supplemental Figure 4A). Notably, giant cells exhibited a loss of committed B-cell lineage markers, such as CD19 and immunoglobulin M, while acquiring B-cell progenitor markers like SOX4, DNTT, and RAG1/2, indicative of a dedifferentiated phenotype31 (Figure 3C-D; supplemental Figure 4B). During reversible morphology transitions, hematopoietic stem cell gene sets were enhanced in giant cell states (G1, G2, and G3) and suppressed in reproliferation states (R1 and R2), whereas mature B-cell signatures (B_CELL_MARKERS) showed reversible regulation,32 a pattern consistently observed across transitions (supplemental Figure 4C). Confirming their stem cell–like properties, giant cells tested positive for alkaline phosphatase (supplemental Figure 4D). Furthermore, luciferase-expressing parental and giant cells were inoculated into NSG mice, followed by treatment with anti-CD19 chimeric antigen receptor (CAR) T cells or untransduced T cells. Luminescence imaging revealed that parental cells were suppressed by anti-CD19 CAR T cells for 4 weeks before resistance occurred, whereas giant cells displayed intrinsic resistance, necessitating euthanasia of the mice by weeks 5 or 6 (supplemental Figure 4E). These findings highlight a reversible and lineage-constrained dedifferentiation phenotype in giant cells.
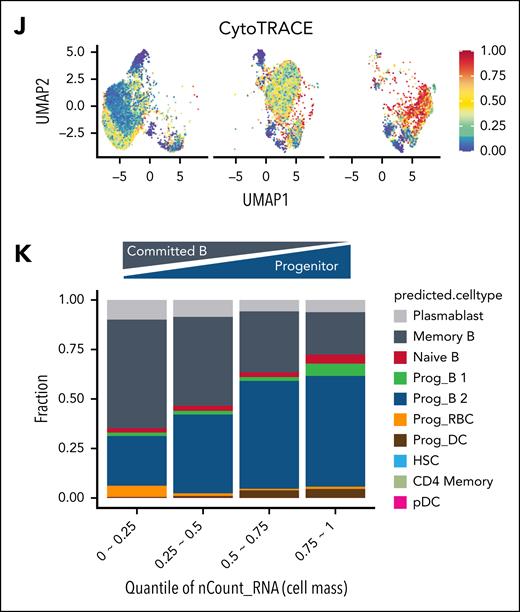
To examine cellular composition and identity, we conducted single-cell RNA-seq analysis on Mino-VEN-R cells treated with pirtobrutinib. Cells were classified into 6 clusters (0 to 5), with cluster 0 comprising dimethyl sulfoxide–treated control cells; and cluster 1 and 2 containing 5 μM and 10 μM pirtobrutinib-treated cells, respectively (Figure 3E). Notably, although ribosome genes were elevated, the proportion of mitochondrial genes decreased after pirtobrutinib treatment (supplemental Figure 5A). Total RNA levels correlated with cell size across escalating pirtobrutinib doses, with cluster 2 exhibiting elevated RNA content and significant enrichment of the Giant_UP signature (Figure 3F). Ribosome biogenesis, recognized as key regulator of cell size,33-37 was markedly enhanced in cluster 2, as evidenced by highly enriched rRNA processing (Figure 3G). Furthermore, fibrillarin, an rRNA methyltransferase and a marker of ribosome biogenesis, was upregulated in giant cells (Figure 3H). Treatment with rRNA synthesis inhibitor, CX-5461, induced death of giant cells (supplemental Figure 5B). In PDO samples, fibrillarin was selectively expressed in pirtobrutinib-induced enlarged cells but not in regular-sized cells (Figure 3I). These findings indicate that giant cells predominate in cluster 2. Differences in ribosome biogenesis can distinguish stem cells from differentiated cells.33,38 In cluster 2, BCR signaling was suppressed and mature B lymphocyte signature genes (UP and DN) were differentially regulated, indicating a loss of committed B-cell identity in giant cells (supplemental Figure 5C). Elevated CytoTRACE scores further confirmed their dedifferentiated state (Figure 3J).39 Increased fractions of cells with progenitor B (B1/B2) or naive B-cell signatures coincided with increased cell mass, alongside reduced fractions of cells with committed B-cell signatures (Figure 3K). These findings suggest that pirtobrutinib potently induces dedifferentiation of Mino-VEN-R cells to giant cells. Upon pirtobrutinib withdrawal, they differentiate to resume proliferation.
The TCA cycle mode switch toggles the giant cell state
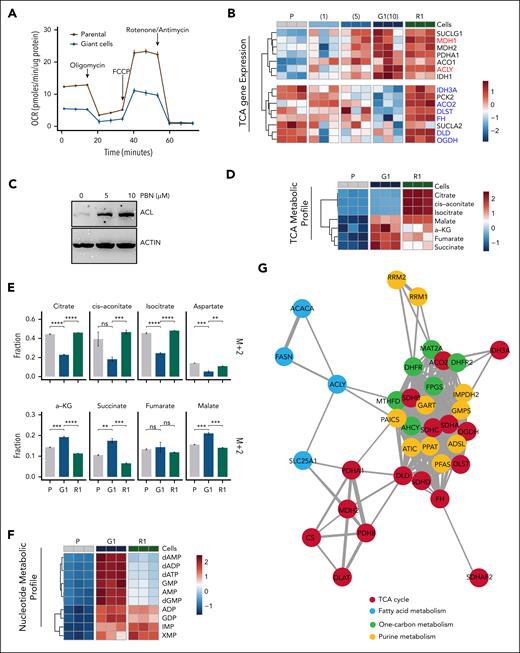
To explore the essential nutrient requirements of giant cells, we found glucose deprivation reduced giant cell viability and size, whereas glutamine deprivation primarily affected parental cells (supplemental Figure 6A-B). Mitochondrial respiration was diminished in giant cells, as evidenced by a reduced OCR (Figure 4A). Additionally, gene expression associated with mitochondrial bioenergetics was downregulated in giant cells (supplemental Figure 5A).
Transcriptomic analysis revealed differential regulation of the TCA cycle–associated genes in giant cells compared with parental cells. Specifically, noncanonical TCA cycle genes Acly (encoding adenosine triphosphate citrate lyase [ACL]) and Mdh1 were upregulated in giant cells, whereas canonical TCA cycle genes, such as Aco2, were downregulated14 (Figure 4B). Protein levels of ACL and SLC25A1 (mitochondrial citrate/malate antiporter, encoded by Slc25a1) increased after pirtobrutinib treatment (Figure 4C; supplemental Figure 6C). These findings suggest the noncanonical TCA cycle is activated in giant cells.14 To determine whether the canonical TCA cycle was downregulated, we performed HRMS to map metabolite profiles of parental cells, giant cells, and R1 cells. The results revealed a robust increase of TCA intermediates, α-ketoglutarate (α-KG), succinate, fumarate, and malate, in giant cells, but not citrate, cis-aconitate, and isocitrate (Figure 4D). This dichotomized profile prompted us to track these intermediates using a [U-13C]glucose tracer assay, which showed an elevated replenishment rate of these TCA cycle intermediates in giant cells (supplemental Figure 6D). Previous studies have demonstrated that reduced M+2 labeling of TCA cycle intermediates downstream of citrate reflects increased engagement with the cytosolic TCA cycle, whereas M+2–labeled malate indicates the conventional TCA cycle activity in converting mitochondrial citrate to malate.14 Consistent with our metabolic profiling results, we observed a significant decrease in the fraction of M+2-labeled intermediates, such as citrate, cis-aconitate, and isocitrate in giant cells compared with parental cells, alongside an increase in M+2-labeled α-KG, succinate, and malate (Figure 4E). Together, these findings indicate a rewired TCA cycle in giant cells, with heightened activity in both the cytosol and mitochondrial compartments to produce α-KG and its downstream intermediates.
Intrigued by the elevated expression of anabolic genes, such as those involved in purine metabolism in giant cells, we sought mechanistic insights into their biosynthetic pathways (supplemental Figure 6E). We found that nucleotides, including purines and pyrimidines, were elevated in giant cells compared with parental and R1 cells, indicating enhanced nucleotide biosynthesis (Figure 4F). Genetic coessentiality mapping of these metabolic genes confirmed a codependency of canonical and noncanonical modes of TCA cycles with 1-carbon and fatty acid metabolism. Notably, nucleotide metabolism genes, particularly those in purine metabolism, were strongly associated with the TCA cycles. Apart from glycolysis, a direct connection between Acly and the purinosome genes Paics and Mthfd1 suggests a regulatory role of the cytosolic TCA cycle in nucleotide metabolism (Figure 4G).
As a result of the activated cytosolic TCA cycle, unlabeled 4-carbon derivatives, such as malate, increased.14 We first observed an elevated replenishment rate of glucose-derived aspartate in giant cells (supplemental Figure 6D). Unlike malate, the unlabeled aspartate (M+0) fraction remained stable, whereas the M+2 fraction decreased (Figure 4E). Concurrently, the M+0 fraction of pyrimidines increased (Figure 4H), suggesting an enhanced supply of unlabeled 4-carbon derivatives upstream of aspartate. Second, giant cells exhibited resistance to 6-mercaptopurine, an anticancer drug that disrupts purine synthesis and metabolism in proliferating cells,40 whereas parental cells were sensitive (supplemental Figure 6F). This resistance in enlarged cells points to an alternative purine synthesis pathway distinct from that in proliferating parental cells. In addition, the replenishment rate of intermediates such as ribose-5-phosphate, linked to the PPP, remained unchanged in giant cells (supplemental Figure 6G), whereas the M+5 fraction of pyrimidines decreased (Figure 4H). These results indicate that giant cells do not preferentially use the PPP for nucleotide biosynthesis. Next, pirtobrutinib treatment dose dependently reduced Got1 expression but increased Got2 expression, a pattern that reversed upon differentiation, suggesting a shift of malate-aspartate shuttle (MAS) activity between the cytoplasm and mitochondria (Figure 4I). GOT2 is a mitochondrial aminotransferase that reversibly produce aspartate and α-KG from glutamate and oxaloacetate, whereas GOT1, its cytosolic isoform, reverses this process and supports the biosynthesis of nucleotides and amino acids. Initially identified as a pathway for oxidizing cytosolic reduced NAD via GOT2,41 the MAS has recently been implicated in regulating the cancer stem cells, linking TCA cycle intermediates with purine synthesis.42Got2 knockdown in giant cells accelerated differentiation, an effect mitigated by acetate supplementation (supplemental Figure 6H), indicating that the MAS sustained giant cell dedifferentiation under the influence of increased acetyl-CoA levels. These findings suggest that the TCA cycle in giant cells shifts to an anabolic mode, enhancing biosynthesis of acetyl-CoA via ACL activity and aspartates via the mitochondrial MAS (Figure 4J). Upon pirtobrutinib withdrawal, giant cells transitioned to a proliferative phenotype by resuming conventional oxidative catabolism.
Cellular signaling driven by acetyl-CoA determines the fate of giant cells
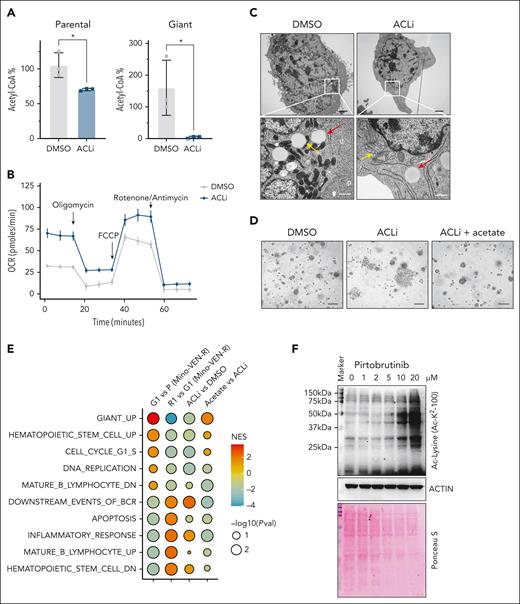
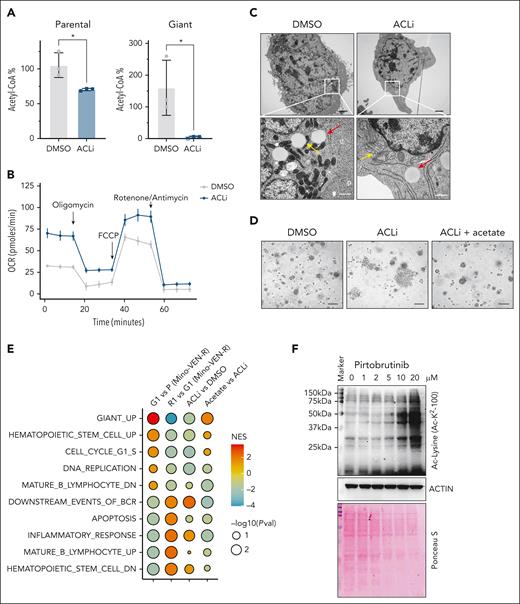
With increased cytosolic TCA cycle activity, mitochondrial citrate exported to the cytosol is converted into acetyl-CoA by ACL, a key enzyme in fatty acid synthesis and epigenetic regulation.43,44 We found that treatment with ACL inhibitor (ACLi; BMS303141) profoundly changed the giant cell phenotype. In ACLi-treated cells, nucleotide levels decreased in both parental and giant cells, yet glycolysis intermediates increased in giant cells relative to parental cells (supplemental Figure 7A). Acetyl-CoA levels were preferentially suppressed in giant cells but not in parental cells (Figure 5A), whereas the OCR was restored (Figure 5B). Notably, in 2D culture, ACLi treatment induced a morphological shift in giant cells from enlarged, granular forms to small, spindle-like cells with shrunken nuclei (supplemental Figure 7B). Transmission electron microscopy revealed that mitochondria in untreated giant cells exhibited a condensed configuration, whereas those in ACLi-treated giant cells adopted an orthodox configuration (Figure 5C). These effects were reversed by acetate supplementation in a dose-dependent manner (supplemental Figure 7C). Furthermore, in spheroid 3D culture, ACLi-treated giant cells differentiated earlier than vehicle-treated controls, an effect delayed by acetate supplementation but not by α-KG or nucleosides (Figure 5D; supplemental Figure 7D-E). Together, these findings indicate that ACL activity is essential for giant cell biology, including elevated nucleotide metabolism and altered mitochondrial morphology, and that its suppression triggers reproliferation in giant cells.
ACL activity determines the states of giant cells. (A) Acetyl-CoA analysis in parental and giant cells treated with or without ACLi (BMS303141) at 10 μM for 48 hours. ∗P < .05. (B) OCR in Mino-VEN-R giant cells treated with or without ACLi (10 μM for 16 hours). (C) Representative transmission electron microscopy imaging of giant cells treated with or without ACLi (10 μM for 48 hours) and acetate supplement (20 mM for 48 hours). Lipid droplet (red arrow) and mitochondria (yellow arrow). Scale bar, 200 nm. (D) Representative imaging showing giant cells reproliferated after drug removal treated with ACLi (10 μM; 9 days); acetate supplement (20 mM) prevented giant cells from reproliferating. Scale bar, 100 μm. (E) GSEA of pathways in P, G1, R1, and G1 treated with ACLi, and G1 treated with ACLi (10 μM) with acetate supplement (20 mM for 48 hours). (F) Western blots showing globally increased acetylation of nonhistone proteins in giant cells. Ponceau S staining shows total protein levels. NES, normalized enrichment score; Pval, P value.
ACL activity determines the states of giant cells. (A) Acetyl-CoA analysis in parental and giant cells treated with or without ACLi (BMS303141) at 10 μM for 48 hours. ∗P < .05. (B) OCR in Mino-VEN-R giant cells treated with or without ACLi (10 μM for 16 hours). (C) Representative transmission electron microscopy imaging of giant cells treated with or without ACLi (10 μM for 48 hours) and acetate supplement (20 mM for 48 hours). Lipid droplet (red arrow) and mitochondria (yellow arrow). Scale bar, 200 nm. (D) Representative imaging showing giant cells reproliferated after drug removal treated with ACLi (10 μM; 9 days); acetate supplement (20 mM) prevented giant cells from reproliferating. Scale bar, 100 μm. (E) GSEA of pathways in P, G1, R1, and G1 treated with ACLi, and G1 treated with ACLi (10 μM) with acetate supplement (20 mM for 48 hours). (F) Western blots showing globally increased acetylation of nonhistone proteins in giant cells. Ponceau S staining shows total protein levels. NES, normalized enrichment score; Pval, P value.
Next, we performed bulk RNA-seq to analyze gene expression profiles of ACLi-treated giant cells with or without acetate supplementation. ACLi suppressed the expression of the Giant_UP signature. ACLi suppressed the Giant_UP signature and, in addition to restoring BCR signaling, reinstated expression of B-cell lineage markers, such as CD19, whereas hematopoietic stem cell pathways were diminished. These ACLi-induced changes mirrored those observed in R1 cells transitioning from giant cells, and most were reversed by acetate supplementation (Figure 5E; supplemental Figure 7F). Lysine acetylation is a reversible posttranslational protein modification that regulates gene expression.45 We found that non–histone protein acetylation was globally elevated in giant cells and reduced by ACLi treatment; this reduction was rescued by acetate supplementation. These indicate that acetylome changes in giant cells are dependent on acetyl-CoA levels (Figure 5F; supplemental Figure 7G).
Acetylated SNAI1 is essential in maintaining dedifferentiation of giant cells
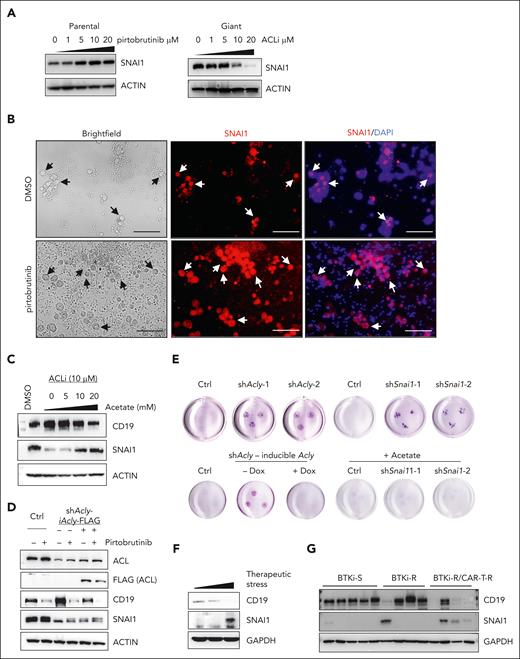
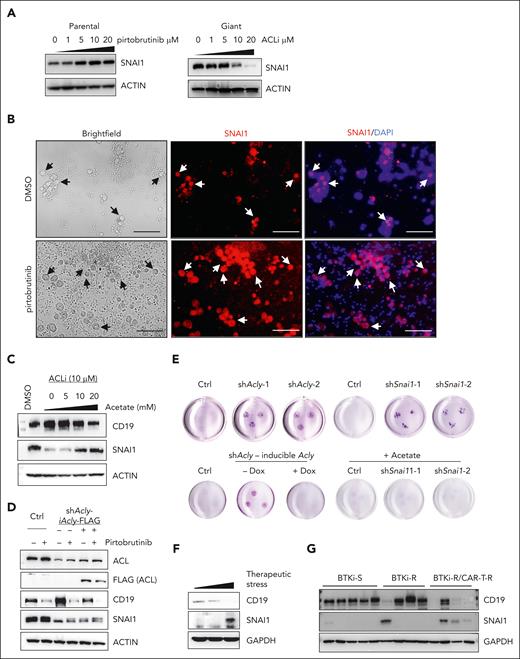
Given that the heightened ACL activity was critical for development and maintenance of giant cells, we investigated downstream effectors of ACL. Notably, levels of SNAI1, a transcription factor driving epithelial-mesenchymal transition, increased in parental cells after by pirtobrutinib treatment and decreased by ACLi in giant cells (Figure 6A). Elevated SNAI1 levels were also selectively observed in enlarged tumor cells within PDOs from patient PT6 (Figure 6B). We next explored the roles of SNAI1 in giant cells and found that it negatively regulated CD19 expression. Knock down of SNAI1 in Mino-VEN-R cells led to a robust increase in CD19, whereas in pirtobrutinib-treated giant cells, sustained SNAI1 levels coincided with suppressed CD19 levels (supplemental Figure 8A). Acetyl-CoA modulated SNAI1 protein levels, as evidenced by acetate supplementation rescuing SNAI1 in ACLi-treated giant cells, with a corresponding downregulation of CD19 (Figure 6C). To assess whether ACL-mediated SNAI1 upregulation was sufficient to drive giant cell development, we induced ACL or SNAI1 expression in Mino-VEN-R cells. In parental cells, neither ACL nor SNAI1 overexpression resulted in CD19 loss; however, in giant cells, induced ACL expression further reduced CD19 levels, whereas SNAI1 overexpression alone did not (supplemental Figure 8B). These findings suggest that SNAI1 is a necessary but not sufficient effector downstream of ACL in maintaining the dedifferentiation state of giant cells, with acetyl-CoA as a key metabolite in regulating SNAI1 protein levels.
Stabilized SNAI1 through acetylation determines the fate of giant cells. (A) Western blots showing the protein levels of SNAI1 in response to PBN treatment for 72 hours and ACLi for 48 hours. (B) Immunofluorescence assay showing the presence of giant cells are indicated by selectively increased levels of SNAI1 in a PDO sample (PT6) treated with or without PBN ex vivo. Arrows indicate the presence of giant cells. Blue, DAPI; red, SNAI1 (Texas red). Scale bar, 100 μm. (C) Western blots of CD19 and SNAI1 in giant cells treated with ACLi and supplemented acetate (48 hours). (D) Western blots showing Dox-inducible expression of FLAG-tagged ACL in Acly-knockdown cells (Dox, 1 μg/mL for 72 hours). (E) Representative spheroid 3D culture (2 weeks) of Acly- or Snai1-knockdown giant cells and Acly-knockdown giant cells with or without Dox-inducible ACL expression. Acetate, 20 mM. (F) Western blots of SNAI1 and CD19 levels in tumors from patients with MCL with increased therapeutic stress. (G) Western blots of SNAI1 and CD19 levels in tumors from patients with MCL sensitive to BTKis (BTKi-S), resistant to BTKis (BTKi-R), and resistant to BTKi and CAR T-cell therapy (BTKi-R/CAR-T-R). Ctrl, control; Dox, doxycycline; GAPDH, glyceraldehyde-3-phosphate dehydrogenase.
Stabilized SNAI1 through acetylation determines the fate of giant cells. (A) Western blots showing the protein levels of SNAI1 in response to PBN treatment for 72 hours and ACLi for 48 hours. (B) Immunofluorescence assay showing the presence of giant cells are indicated by selectively increased levels of SNAI1 in a PDO sample (PT6) treated with or without PBN ex vivo. Arrows indicate the presence of giant cells. Blue, DAPI; red, SNAI1 (Texas red). Scale bar, 100 μm. (C) Western blots of CD19 and SNAI1 in giant cells treated with ACLi and supplemented acetate (48 hours). (D) Western blots showing Dox-inducible expression of FLAG-tagged ACL in Acly-knockdown cells (Dox, 1 μg/mL for 72 hours). (E) Representative spheroid 3D culture (2 weeks) of Acly- or Snai1-knockdown giant cells and Acly-knockdown giant cells with or without Dox-inducible ACL expression. Acetate, 20 mM. (F) Western blots of SNAI1 and CD19 levels in tumors from patients with MCL with increased therapeutic stress. (G) Western blots of SNAI1 and CD19 levels in tumors from patients with MCL sensitive to BTKis (BTKi-S), resistant to BTKis (BTKi-R), and resistant to BTKi and CAR T-cell therapy (BTKi-R/CAR-T-R). Ctrl, control; Dox, doxycycline; GAPDH, glyceraldehyde-3-phosphate dehydrogenase.
To explore how ACL regulates SNAI1 and CD19 in giant cells, we restored ACL expression in Acly-knockdown cells (Figure 6D). Acly knockdown reduced SNAI1 protein levels, whereas ectopically induced ACL expression or pirtobrutinib treatment elevated SNAI1 protein levels likely through protein modification, such as acetylation. Correspondingly, CD19 increased upon Acly knockdown and decreased with Acly overexpression or pirtobrutinib treatment. In spheroid culture assays, Acly or Snai1 knockdown accelerated the exit of giant cells from their dedifferentiation state compared with control giant cells. Restoring ACL expression in Acly-knockdown giant cells or administering acetate supplementation in Acly- or Snai1-knockdown giant cells delayed differentiation (Figure 6E; supplemental Figure 8C). The phenotypes were consistent in JeKo-1-IBN-R cells (supplemental Figure 8D-J).
Acetyl-CoA provides acetyl groups for protein modifications, including SNAI1 stabilization.46 After cycloheximide treatment, SNAI1 levels in giant cells remained stable relative to parental cells. Immunoprecipitation assays of FLAG-tagged SNAI1 in Mino-VEN-R cells showed that wild-type SNAI1, but not a mutant (K146R/K187R), was significantly acetylated and stabilized after pirtobrutinib treatment (supplemental Figure 8 K-L). In 1 patient with MCL, SNAI1 levels increased, whereas CD19 levels decreased with accumulated therapeutic stress (Figure 6F). Moreover, in tumors from patients with MCL, SNAI1 levels were not increased with BTKi resistance alone; however, patients who subsequently developed resistance to CAR T-cell therapy exhibited elevated levels of SNAI1 and reduced CD19 (Figure 6G). These findings suggest acetyl-CoA stabilizes SNAI1 by acetylation, highlighting the clinical relevance of elevated SNAI1 levels in patients with therapy-resistant MCL.
The dynamic presence of DTP cells traversing giant cell state in patients with therapy-resistant MCL
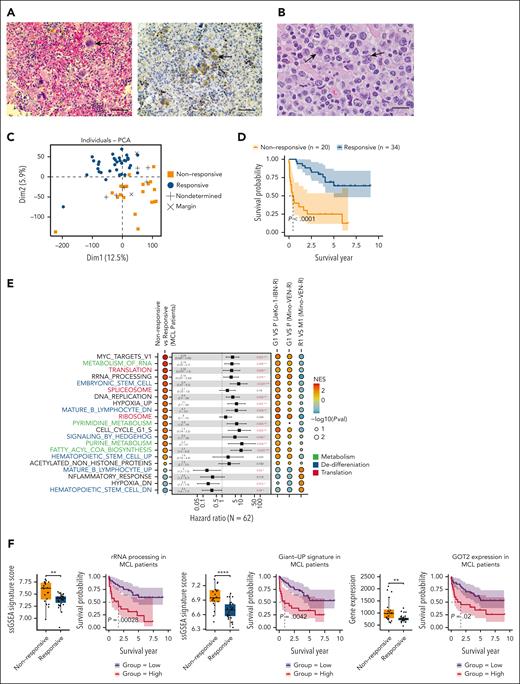
In a PDX sample from a patient with pirtobrutinib-resistant MCL, we identified multinucleated giant cells. This patient had undergone multiple treatments, including chemotherapy, rituximab, IBN, and CAR T-cell therapy, but experienced relapses after each intervention. After these therapies, the patient received pirtobrutinib, initially responding but relapsing 1 year later; we collected the sample at this relapsed time point. These giant cells exhibited elevated GOT2 levels (Figure 7A). Notably, enlarged tumor cells were also readily detectable in primary samples from patients with resistance to IBN (Figure 7B). We hypothesize that DTP cells traversing through the giant cell state are present in more patients with MCL with therapy resistance. Within the context of transcriptional heterogeneity, the conservation of diverse functional properties drives tumor progression, and the relationship between differentially expressed gene modules and patient survival is important for understanding the emergence of specific cell states.10 Accordingly, we performed whole-transcriptome RNA-seq on 62 specimens from 59 patients with MCL (supplemental Methods). Principal component analysis revealed a clear separation between groups responsive vs nonresponsive to systemic therapies (Figure 7C), and a Kaplan-Meier survival analysis indicated a poorer prognosis for the nonresponsive group (Figure 7D). Consistent with RNA-seq results from giant cells, GSEA-identified upregulated pathways in the nonresponsive group, including nucleotide metabolism, stem cell regulation, and translational control, whereas mature B-cell signatures (UP and DN) were reversibly regulated. Cox proportional hazards regression for survival further confirmed that these GSEA-identified pathways were associated with an increased risk of poor diagnosis in patients with MCL (Figure 7E). Expression of rRNA processing and Giant_UP signatures, along with GOT2, was elevated in patients with nonresponsive MCL compared with responsive patients, and corelated with reduced survival probability (Figure 7F). These results support that the dynamic, rather than rare, presence of DTP cells in therapy-resistant patients can be driven by reprogrammed metabolism favoring biosynthesis. This metabolic shift contributes to tumor cell heterogeneity across B-cell hierarchy, conferring stable resistance to therapies.
The dynamic presence of DTP cells traversing giant cell state in patients with therapy-resistant MCL. (A) Representative H&E imaging and immunohistochemistry staining of giant cells (arrowed) from the PDX sample with resistance to both anti-CD19 CAR T-cell therapy and PBN showing increased GOT2 level. Scale bar, 50 μm. (B) Representative image showing MCL with pleomorphic morphology in patient after IBN treatment. Enlarged lymphoma cells (predominantly >10 micron in nuclear diameter) were observed to have highly irregular nuclear contours, partially open chromatin, occasional distinct nucleolus, and moderate amount of cytoplasm (arrowed). H&E, ×1000 with oil. Scale bar, 20 μm. (C) PCA showing responses to systemic therapies in patients with MCL. (D) Kaplan-Meier analysis showing survival probability of patients with MCL (responsive vs nonresponsive). (E) GSEA-identified signaling pathways regulated in nonresponsive patients and the Giant cell model. Listed pathways featured in Giant cells are ranked by a NES and colored by pathway types; Cox proportional hazards univariate analysis identified enriched pathways in nonresponsive patients with MCL. False discovery rate q values labeled as indicated. Functional categories are labeled as indicated colors. (F) ssGSEA scores of rRNA processing, Giant_UP gene signatures, and Got2 expression in patients with MCL. Kaplan-Meier survival curves using the rRNA processing, Giant_UP signature scores, and Got2 expression (responsive vs nonresponsive to therapies), with log-rank P = .00028, P = .0042, and P = .02, respectively. ∗∗P < .01; ∗∗∗∗P < .0001. NES, normalized enrichment score; PCA, principal component analysis; Pval, P value; ssGSEA, single sample gene set enrichment analysis.
The dynamic presence of DTP cells traversing giant cell state in patients with therapy-resistant MCL. (A) Representative H&E imaging and immunohistochemistry staining of giant cells (arrowed) from the PDX sample with resistance to both anti-CD19 CAR T-cell therapy and PBN showing increased GOT2 level. Scale bar, 50 μm. (B) Representative image showing MCL with pleomorphic morphology in patient after IBN treatment. Enlarged lymphoma cells (predominantly >10 micron in nuclear diameter) were observed to have highly irregular nuclear contours, partially open chromatin, occasional distinct nucleolus, and moderate amount of cytoplasm (arrowed). H&E, ×1000 with oil. Scale bar, 20 μm. (C) PCA showing responses to systemic therapies in patients with MCL. (D) Kaplan-Meier analysis showing survival probability of patients with MCL (responsive vs nonresponsive). (E) GSEA-identified signaling pathways regulated in nonresponsive patients and the Giant cell model. Listed pathways featured in Giant cells are ranked by a NES and colored by pathway types; Cox proportional hazards univariate analysis identified enriched pathways in nonresponsive patients with MCL. False discovery rate q values labeled as indicated. Functional categories are labeled as indicated colors. (F) ssGSEA scores of rRNA processing, Giant_UP gene signatures, and Got2 expression in patients with MCL. Kaplan-Meier survival curves using the rRNA processing, Giant_UP signature scores, and Got2 expression (responsive vs nonresponsive to therapies), with log-rank P = .00028, P = .0042, and P = .02, respectively. ∗∗P < .01; ∗∗∗∗P < .0001. NES, normalized enrichment score; PCA, principal component analysis; Pval, P value; ssGSEA, single sample gene set enrichment analysis.
Discussion
In this study, we demonstrate that giant cells represent a subgroup of transitioning, stem-like DTP cells characterized by cellular enlargement and enhanced biosynthesis. Our biphasic model reveals that switches between TCA cycle modes guides cell fate, which is different from the cancer stem cell paradigm that heavily relies on the tumor microenvironment.47 Giant cells are constrained to the original development program of B cells, and eventually embark on a track toward permanent therapy resistance.
Although more potent therapies targeting proliferating cancer cells aim to overcome therapy resistance, often by disrupting mitochondrial electron transport chain activity or oxidative phosphorylation to induce cell death,48,49 Giant cells evade these strategies by adopting a transient, nonproliferative state, sustained by anaerobic anabolism. These cells exhibited pronounced changes in mitochondrial morphology with suppressed activity, which revert upon drug withdrawal or ACLi treatment. In giant cells, hypoxia-associated gene signatures were upregulated during dedifferentiation and diminished upon differentiation, a pattern also observed in patients with therapy-resistant MCL (Figure 7E). Similarly, hypoxia regulates stem cell fate through cytosolic acetyl-CoA by SLC25A1 activity,50 and polyploid giant cancer cells can be induced by hypoxic conditions.51 Thus, therapy-induced hypoxia may play a critical role in establishing the giant cell state.
Phenotypic plasticity, an emerging hallmark of cancers, enables multiple cancer cell identities under therapeutic stress, although the mechanisms unlocking this plasticity require further exploration.6,52 Nongenetic mechanisms, such as metabolism adaptation, likely drive this shift, with the TCA cycle as an amphibolic pathway with diverse activity.53,54 In the context of electron transport chain dysfunction, the MAS reverses to produce, rather than consume, cytosolic aspartate55,56; and purine metabolism remodels in tumor cells to shield tumors from chemotherapies.49 In giant cells, a hypoxia-like phenotype increases citrate export to the cytosolic TCA cycle, driven by ACL activity. The rewired TCA cycle engages in biosynthesis by activating the mitochondrial MAS. Consequently, this metabolic switch unlocks the cellular plasticity of DTP cells. Pirtobrutinib treatment elevates acetyl-CoA levels, leading to globally increased non–histone protein acetylation in giant cells. Beyond SNAI1, GOT2 acetylation is enhanced in giant cells (supplemental Figure 8M), consistent with reports that acetylated GOT2 strengthens the GOT2-MDH2 interaction to boost mitochondrial MAS activity.57 However, we observed no significant increase in acetylation of histone markers, including H2AK5, H2BK5, H3K9, and H4K8 (supplemental Figure 8N). Further investigations into the acetylome of nonhistone proteins in DTP cells are warranted, as these modifications may reversibly regulate gene expression.58
SNAI1, previously implicated in regulating rRNA synthesis during epithelial-mesenchymal transition,33 emerges as a key player in giant cells. We found that the ACL-SNAI1 axis governs giant cells development, enhancing ribosome biogenesis and profoundly influencing cell state. Our results suggest that targeting rRNA synthesis could inhibit giant cells and elevated ribosome biogenesis may serve as a marker of this cell population. Additional studies are needed to elucidate how SNAI1 modulates ribosome biogenesis in DTP cells.
Furthermore, we underscore the prevalence of DTP cells in patients with therapy-resistant MCL, exhibiting a full spectrum of transitioning states and increasing heterogeneity after repeated therapeutic challenges. Giant cells lie at the epicenter. The dynamic interplay between TCA cycle modes rewires communication between mitochondria and the nucleus, unlocking DTP cell plasticity, and enabling a Lamarckian-like evolution distinct from Darwinian selection. We emphasize the critical need to effectively manage giant cells before permanent resistance solidifies.
Acknowledgments
The authors thank all people who have donated to the Mantle Cell Lymphoma Program of Excellence in the Division of Cancer Medicine, Department of Lymphoma/Myeloma, at the MD Anderson Cancer Center. They also thank Paul Dolber and Tracey Baas for their critical editing of the manuscript. They thank Zhenbo Han from Molecular and Cellular Oncology, MDACC, for his technical support on cell live imaging. The authors acknowledge the valued service from the MDACC core facility, supported by RP180684 (CPRIT Single Cell Genomics Core Facility), National Cancer Institute, National Institutes of Health grant CA016672 for Advanced Technology Genomics Core, and National Institutes of Health 1S10OD024977-01 for the NovaSeq6000. They also acknowledge the high-resolution electron microscopy facility and The University of Texas Austin Mass Spectrometry Imaging Facility supported by Cancer Prevention and Research Institute of Texas Award RP240559.
This study was also supported by the National Institutes of Health–funded Cancer Center Support Grant P30 CA016672 (Peter Pisters, principal investigator), and philanthropy funds from the Gary Rogers Foundation, Steve and Nancy Fox funds, and the Cullen Foundation.
Authorship
Contribution: W.W. and M.W. conceptualized the study; M.W. supervised the study; W.W. and M.W. designed the study; W.W., Y. Liu, Y. Li, H.-H.L., Y.Y., Y.F., and L.N. acquired the data; W.W., Q.C., Y. Liu, H.-H.L., Y.F., J.Y., and F.Y. analyzed the data; W.W. and Y. Liu interpreted the data; L.T., P.L.L., Y.-N.W., Z.C., J.M.M., C.-T.Y., P.J., V.C.J., J.V., X.L., T.Z., S.L., D.S., S.T., E.H.S., and L.M.S. provided technical support; C.F. provided administrative support; C.Y.O. provided clinical patient samples; W.W. wrote the original draft; W.W. and M.W. reviewed and edited the manuscript; M.W. acquired funding; and all authors read and approved the final manuscript.
Conflict-of-interest disclosure: M.W. reports consulting for AstraZeneca, Bristol Myers Squibb, Boxer Capital, Galapagos NV, Genmab, InnoCare, Janssen, Kite Pharma, Lilly, Merck, Physicians Education Resource (PER), Pepromene Bio, Pfizer, and Oncternal; receiving research funding from AbbVie, AstraZeneca, Bantam Pharma, BeOne, Genmab, Genentech, InnoCare, Janssen, Juno Therapeutics, Kite Pharma, Lilly, Nurix Therapeutics, Oncternal, and Pharmacyclics; and receiving honoraria from AstraZeneca, BeOne, Binaytara Foundation, Bristol Myers Squibb, CAHON, Editorial Medica AWWE SA, East Virginia Medical School, Instituto Scientifico Romagnolo, Janssen, Kite Pharma, Mayo Clinic, MJH Life Sciences, Merck, Maria Sklodowska-Curie National Research Institute of Oncology, Pfizer, PER, Plexus Communications, PromCon S.R.E., Research To Practice, Studio ER Congressi, Medscape/WebMD, and VJHemonc. The remaining authors declare no competing financial interests.
Correspondence: Michael Wang, The University of Texas MD Anderson Cancer Center, 1515 Holcombe Blvd, Houston, TX 77030; email: miwang@mdanderson.org.
References
Author notes
W.W., Q.C., Y. Liu, L.N., and H.-H.L. contributed equally to this study.
The bulk RNA-sequencing and single-cell RNA-sequencing data generated in this study have been deposited in the European Genome-phenome Archive (available at https://ega-archive.org/; accession numbers EGAD50000001578 [Exome Sequencing], EGAD50000001579 [RNA-seq of Mantle Cell Lymphoma Cell Lines Treated with Pirtobrutinib], EGAD50000001580 [Transcriptomic Profiling of Mantle Cell Lymphoma Patient Samples via RNA Sequencing], and EGAD50000001581 [Single-Cell Transcriptomic Profiling of Mino-VEN-R Cell Line]). All R scripts supporting the findings of this article will be found in the GitHub repository (https://github.com/WangLabMDA/DTP).
Original data are available on request from the authors, Wei Wang (wwang4@mdanderson.org), Qingsong Cai (QCai1@mdanderson.org), Yang Liu (YLiu22@mdanderson.org), Lei Nie (LNie@mdanderson.org), or Heng-Huan Lee (hhlee@mdanderson.org).
The online version of this article contains a data supplement.
There is a Blood Commentary on this article in this issue.
The publication costs of this article were defrayed in part by page charge payment. Therefore, and solely to indicate this fact, this article is hereby marked “advertisement” in accordance with 18 USC section 1734.




![The TCA cycle mode switch toggles the fate of giant cells. (A) OCR in Mino-VEN-R parental and giant cells, normalized by protein amount. (B) Heat map of the TCA cycle–associated genes expression. A dichotomized profile of genes in the noncanonical (red) and canonical TCA cycle (blue). (C) Western blots of ACL in Mino-VEN-R cells treated with increasing doses of PBN. (D) Metabolites profiles of the TCA cycle intermediates. (E) Fraction enrichment of [U-13C]glucose–labeled intermediates (M+2) associated with TCA cycle was differentially regulated in P, G1, and R1 cells. (F) Heat map of representative nucleotides in P, G1, and R1 cells. (G) Coessentiality map of genes encoding metabolic enzymes, including 2 TCA cycle modes, clustered with purine metabolism. Correlation strength is indicated by the length and thickness of the connecting edges. (H) Fraction enrichment of [U-13C)]glucose–labeled pyrimidine intermediates (M+0 and M+5) was differentially regulated in P, G1, and R1 cells. (I) Expression of Got1 and Got2 was inversely regulated in parental Mino-VEN-R cells (P), PBN-treated (1 or 5 μM) cells, G1, and R1. Unpaired t test. ∗P < .05; ∗∗P < .01; ∗∗∗P < .001; ∗∗∗∗P < .0001. (J) Schematic illustration of the rewired TCA cycle in giant cells. ADP, adenosine diphosphate; AMP, adenosine monophosphate; CDP, cytidine diphosphate; CMP, cytidine monophosphate; CTP, cytidine triphosphate; dADP, deoxyadenosine diphosphate; dAMP, deoxyadenosine monophosphate; dATP, deoxyadenosine triphosphate; FCCP, carbonyl cyanide 4-(trifluoromethoxy)phenylhydrazone; GDP, guanosine diphosphate; GMP, guanosine monophosphate; IMP, inosine monophosphate; ns, nonsignificant; UDP, uridine diphosphate; UMP, uridine monophosphate; UTP, uridine triphosphate; XMP, xanthosine monophosphate.](https://ash.silverchair-cdn.com/ash/content_public/journal/blood/146/21/10.1182_blood.2024026919/2/m_blood_bld-2024-026919-gr4hj.jpeg?Expires=1766718981&Signature=zXhO9sVieLS5xMNRRKX3wVYr0oH16OIrH0~wj2gbUv8trLPop3~xbjRCd5S7oKl~uvm3l48PRuMj3XHC6fK1RIIpHGoOt7xm0dVZuIdfkg~cThgJfwAtRj1pPfePXKU7ymjbh7A69lmWaQkw5fMiLYC1KTevej6d4rYx4~eIFhCOQFM4IRFBOJLGcGuMgMveKgn2z9f-BFYUcWn4Og~0zmk7O79Wv~aknEOrIYUQ5Ynqkrue9kfE3mI4eDejgRY9w~u5kZ27s116Rloqn8hB7WaGoDq2aPGIfEbwipGvPRmUTqZx8f8nqAmb~ojsUHhjLinZ7SJLpyOodiLs~RdSlg__&Key-Pair-Id=APKAIE5G5CRDK6RD3PGA)
